

When a custom Sales Order Master Business FunctionA complex JDE program that centralizes logic for a specific business entity, ensuring data integrity across multiple tables. like B4200310A standard JD Edwards C business function used for processing Sales Order header information. throws a generic asynchronous kernel error, developers often waste hours blindly refactoring C code. In JDE 9.2 environments, the vast majority of BSFNBusiness Function; a reusable piece of code in JD Edwards that performs specific business logic or database operations. failures—often three-quarters or more—are not logic flaws but run-time memory pointerA programming variable that stores the memory address of another value rather than the value itself. violations, unmapped cacheA temporary storage area in memory used to hold data for quick access during processing. operations, or mismatched data structures. Mastering advanced JDE BSFN debugging techniques using Server ManagerA web-based management console used to monitor, configure, and manage JD Edwards enterprise servers and instances. logs and JDE logs is the most direct way to bypass guesswork and isolate the exact line of failing C code.
Stop relying solely on local fat clientA Windows workstation with a full installation of JD Edwards development tools and local specifications. debugging for server-side failures. When a UBEUniversal Batch Engine; the JD Edwards tool used to run reports and background batch processing jobs. fails on an enterprise server running Tools Release 9.2.8, local execution often masks the database lockingA mechanism that prevents multiple users from modifying the same database record simultaneously to ensure data consistency. or concurrency issues causing the crash. Instead, configure Server Manager to dynamically elevate logging for specific CallObject kernelsSpecific server processes responsible for executing business functions requested by web users or batch jobs., capturing the precise memory dump and SQLStructured Query Language; the standard language used to communicate with and manipulate databases. statement execution path without forcing a service restart.
Isolating BSFN Failures in the Local jde.log
The local jde.logA primary log file in JD Edwards that records engine-level errors and system messages for a specific session. acts as the primary flight recorder for the local development client runtime, capturing fatal errors and unexpected return codes. When a fat client crashes during a local web session, developers often waste hours scanning the wrong logs or immediately launching a debugger. Instead, opening the local jde.log in the E920\client\Output directory should be the immediate first step. It is the only place where the EnterpriseOne engine immediately dumps raw memory violations before the Windows operating system terminates the active activeConsole.exeThe main executable process for the JD Edwards EnterpriseOne Windows-based development client. or javaw.exeThe Java Runtime process used to run the JD Edwards web client interface on a workstation. process.
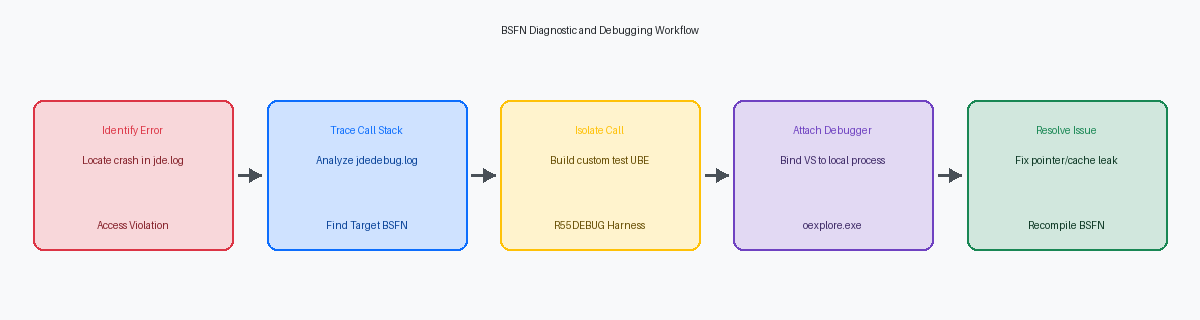
A typical BSFN memory violation, such as an uninitialized pointer or a null pointer assignment, manifests in this log as a 0xC0000005 Windows Access Violation. Alternatively, if the runtime fails to load the compiled DLLDynamic Link Library; a file containing code and data that can be used by multiple programs at the same time. itself—often due to a missing spec definitionThe metadata that defines how a JD Edwards object, like a table or application, is structured and behaves. or a mismatch between the local parent packageA full set of compiled JD Edwards objects and specifications deployed to a client or server. and the path codeA set of specifications and objects that define a specific JDE environment, such as Development or Production.—you will see an explicit COB0000012 load library failure. These errors are not generic application failures; they represent low-level execution failures that require immediate structural resolution before any further application testing can occur.
Tracing Call Stacks with jdedebug.log
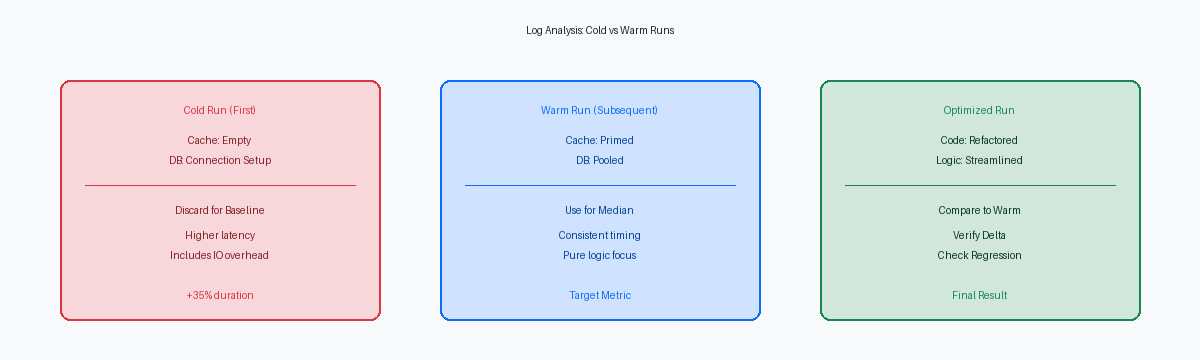
Activating global tracing on a production Enterprise Server is a guaranteed way to bring operations to a halt. Enabling jdedebug.logA detailed trace log that records every step of a program's execution, including database calls and function parameters. (commonly referred to as the trace log or calloid log) globally degrades system performance by more than half, sometimes up to three-quarters, and can fill a 100 to 200 GB disk partition in less than an hour. Despite this overhead, it remains the definitive tool for diagnosing runtime failures because it captures every nested business function call alongside its exact input and output parameter values.
Isolating a failure within a heavy Master Business Function like F4211FSBeginDocA major JDE business function responsible for initializing and validating the header of a sales order. requires tracking execution flow down multiple levels of nesting. By searching the trace log for the entry indicator -> and the corresponding exit indicator <-, you can map out the exact sequence of the call stack. When a Sales Order entry fails with a cryptic "Record Invalid" error, comparing the line numbers of these markers reveals precisely which sub-routine—such as F4211PreProcessHeader—returned a non-zero status.
Beyond mapping the execution path, developers must inspect the raw data structures printed immediately after the entry marker. Look closely at the data types and memory allocation boundaries; a common source of memory violations is passing uninitialized pointers or blank key fields into C BSFNs. If a MathNumericA specialized JDE data type used to store and manipulate numeric values with high precision. field contains garbage characters instead of a valid zero, or if a branch/plant parameter contains trailing nulls instead of spaces, the trace log exposes these structural mismatches before they cause a hard kernel crash. To capture this safely, use Server Manager to toggle tracing dynamically for a single targeted callobject kernel process associated with the test user's session.
Harvesting Server Logs via Server Manager
When a BSFN runs on the Enterprise Server, its log output is directed to a specific Call Object Kernel (COK) process rather than the local workstation. Debugging a production issue requires mapping the user's web session directly to the correct operating system PIDProcess Identifier; a unique number assigned by the operating system to a specific running program. on the logic tierThe server layer in a multi-tier architecture where business logic and calculations are processed.. You cannot search a local directory; you must target the active jde_*.log generated by that specific kernel instance on your enterprise server.
Server Manager eliminates the need to restart JDE services to capture a trace. Administrators can navigate to the Enterprise Server instance, locate the user session, and dynamically enable tracing for just that PID. This surgical approach avoids the storage-destroying mistake of enabling global Output=FILE in the server's jde.iniThe primary configuration file for JD Edwards, containing settings for paths, logging, and system behavior., which can generate tens of gigabytes of log files within minutes on a busy production system.
When a custom C business function suffers a pointer violation, the hosting COK process crashes, transitioning to a "zombie" state. This event triggers an operating system core dump and halts the thread. Server Manager detects this state change and packages the resulting jde_*.log and call stack dump, allowing developers to download the diagnostic package directly from the console without requesting SSH accessSecure Shell; a network protocol that provides a secure way to access and manage a remote server..
Correlating the exact timestamp of a web client timeout with the active COK logs is critical for diagnosing database deadlocksA situation where two or more processes are unable to proceed because each is waiting for the other to release a resource. inside custom BSFNs. In a recent recovery of a distribution client's inventory process, matching a 90- to 120-second web timeout with the corresponding jdedebug.log revealed an unreleased record lock in F41021The JD Edwards database table that stores item balance and availability information for specific inventory locations. caused by a custom NERNamed Event Rule; a JDE-specific programming language that allows developers to write business logic without using C code.. Inspecting the SQL statements immediately preceding the timeout in the harvested log pinpointed the exact line failing to release the reservation.
Building a Minimally Reproducible Test Case
Stepping through a complex business function like F4211FSEditLineA critical JDE business function that processes and validates individual detail lines within a sales order. directly inside the massive event rulesThe JDE-specific logic triggered by user actions or system events within applications and reports. of P4210The standard JD Edwards interactive application used for entering and managing Sales Orders. is a highly inefficient way to isolate a failure. P4210 contains hundreds of form events, grid validations, and parallel business function calls that pollute your local log files and waste hours of development time. Developers must isolate the specific BSFN failure using a clean, reproducible test case that targets the exact parameters of the failing execution.
You can construct this test case by parsing the exact input parameters captured from your raw jdedebug.log and mapping them directly to a simple custom UBE or a modern OrchestratorA JDE tool used to integrate external systems and automate business processes through REST services. orchestration. Using a dedicated test harness UBE, which we typically name R55DEBUG, allows you to execute the BSFN in a highly controlled, synchronous batch environmentA processing mode where tasks are executed one after another, waiting for each to finish before starting the next.. This approach strips away complex UI-driven event rules, control-level variables, and asynchronous processing behaviors that frequently obscure the root cause of the error.
Isolating the BSFN call in a clean execution thread also guarantees that internal JDE cache operations, such as those managed by the F4211SOHeaderCacheA specialized business function used to manage temporary memory storage for sales order header data during entry. business function, do not carry dirty state or corrupted memory from unrelated preceding transactions. In standard sales or purchase order entry, a leaked pointer or an uninitialized cache memory block from an earlier step can cause the target BSFN to fail unpredictably later in the transaction. Executing the target function inside your test harness with known-good inputs ensures that any memory allocation or cache initialization issues are purely internal to the BSFN under investigation, rather than side effects of the parent application's state.
Debugging C BSFNs Locally with Visual Studio
Local C business function debugging remains the most reliable way to isolate memory leaks and pointer corruption before code reaches the enterprise server. To begin, you must build the target BSFN in 'Debug' mode through the Object Management Workbench (OWM)The central JDE tool for managing the lifecycle of software objects like applications and business functions. on your fat client. This build process is critical because it compiles the C code with debug symbolsAdditional information stored in a compiled file that helps a debugger map machine code back to source code., generating the necessary .pdb files in the local bin32 or bin64 directory. Without these symbol files, Visual Studio cannot map the compiled machine instructions back to your readable C source code, rendering breakpoints useless.
Once the debug build completes, launch your local JDE web client. Open Visual Studio with administrative privileges—a step developers frequently miss, resulting in access-denied errors during process attachment. From the Debug menu, select "Attach to Process" and locate the active JDE runtime engine, which is typically oexplore.exeThe legacy executable process used to run the JD Edwards EnterpriseOne solution explorer on Windows. for older 32-bit fat clients or activeera.exeThe modern executable process for the JD Edwards EnterpriseOne web development client. when running modern web development clients in your DV920The standard name for the JD Edwards Development environment where new code is created and tested. environment. Attaching directly to this active process links the Visual Studio debugger to the JDE runtime instance, allowing you to intercept execution flow on the fly.
With the debugger attached, open the C source file directly from your path code's source directory, such as C:\E920\DV920\source\B4200310.c. Set your breakpoint on the target line of code, then trigger the business function by executing the corresponding application or UBE locally. When execution pauses, Visual Studio provides direct visibility into the runtime memory state within the Watch window. Because JDE passes generic pointers, you must manually cast JDE-specific pointers like lpVoid or the data structure pointer lpDs to their explicit typedef structures, such as (LPDST4200310)lpDs, to inspect internal variables, cache pointers, and math numeric values in real time.
Analyzing Database and Cache State Failures
A significant portion of BSFN troubleshooting stalls because developers assume a successful APIApplication Programming Interface; a set of rules and tools that allow different software components to communicate. return code guarantees valid data. In reality, functions like JDB_FetchA JDE database API used to retrieve a single row of data from a table based on specific criteria. frequently return success while silently yielding unexpected null values into the target structure. This occurs when the underlying database table column is defined as nullable but the JDE table specifications expect a default value, bypassing standard C-code error handlers.
Memory corruption and Call Object Kernel crashes are often traced back to improper cleanup of JDE internal cache APIs. When a developer initializes a cache using jdeCacheInitA JDE API used to initialize a new temporary memory storage area for data processing. and populates it via jdeCacheAddA JDE API used to add a new record to an existing temporary memory cache., any subsequent error path that exits the BSFN without calling jdeCacheTerminateA JDE API used to clear and close a temporary memory cache to prevent memory leaks. leaks memory. If this BSFN is executed thousands of times a day in a high-volume environment, the kernel will eventually exhaust its address space and terminate abruptly, dropping active user sessions.
To diagnose these data-access anomalies, compare the raw SQL statements generated in the jdedebug.log directly against the database using a tool like Oracle SQL Developer. This comparison often reveals mismatched table joins or missing indices within the BSFN. Running an EXPLAIN PLANA database command that shows the execution path the database engine will take to run a specific query. on the extracted SQL tomorrow morning will immediately expose why a custom UBE is taking several hours instead of a few minutes.
Inspecting the cache keys output in the trace log is the only way to verify if a record is being overwritten or fetched using an incorrect index structure. The log captures the exact key buffer passed to jdeCacheFetchA JDE API used to retrieve a specific record from a temporary memory cache., showing if a mismatched data type or uninitialized variable has corrupted the search key before the API executes.
Isolating low-level memory leaks, pointer corruption, and cache mismatches requires a systematic approach to log analysis across both local and server-side runtimes. By combining targeted Server Manager tracing with local Visual Studio debugging and isolated test cases, developers can transform a days-long troubleshooting cycle into a structured, minutes-long resolution process.
If your team is struggling with persistent Call Object Kernel crashes, custom business function performance bottlenecks, or complex upgrade-related spec mergesThe process of combining object specifications from different versions during a JD Edwards software upgrade., contact our enterprise JDE consulting group today to optimize your system stability and accelerate your development workflows.
