

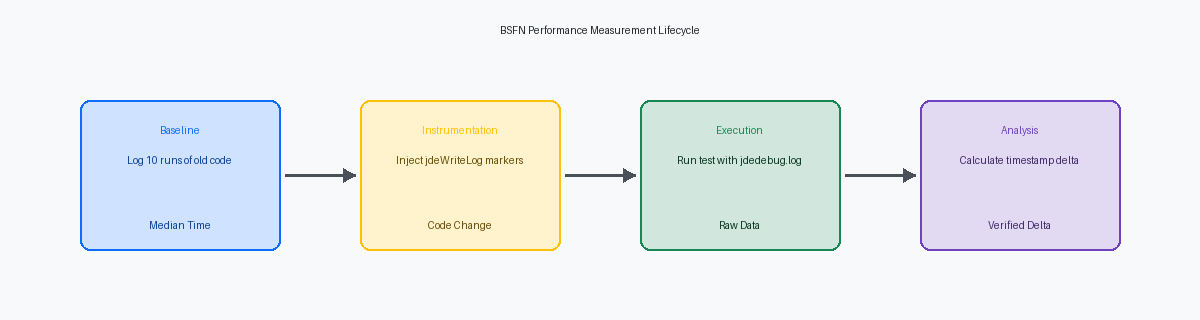
Developers often burn 40–60 hours of development time chasing "slow" BSFNsBusiness Functions (BSFNs) are reusable pieces of logic in JD Edwards, often written in C, that perform specific tasks like calculating prices or updating inventory. based on subjective user feedback from a Sales Order Entry (P4210)P4210 is the standard JD Edwards application used by sales teams to create, modify, and manage customer sales orders. session. Relying on a manual stopwatch to time a Power FormA type of user interface form in JD Edwards EnterpriseOne, designed for efficient data entry and display, often combining multiple sub-forms. is a mistake when the actual bottleneck might be a 500ms or greater latency spike hidden within the Call Object kernelA server process in JD Edwards that executes business functions (BSFNs) and handles communication between the application and the database. or a poorly indexed custom table. True JD Edwards BSFN performance measurement with logs and timings requires moving beyond the application layer and interrogating the microsecond-level timestamps generated in the jdedebug.logA detailed log file generated by JD Edwards, containing execution traces, SQL statements, and timestamps, crucial for debugging and performance analysis..
A heavy-duty BSFN like B4200310A specific Master Business Function in JD Edwards, primarily responsible for processing sales order information and coordinating related updates. can easily spit out 100,000 lines of log data for a single multi-line order, making generic log analysis inefficient. You should inject specific jdeWriteLogAn Application Programming Interface (API) in JD Edwards that allows developers to insert custom messages and timestamps directly into the jdedebug.log file. APIAn Application Programming Interface (API) is a set of rules and definitions that allows different software applications to communicate and interact with each other. calls directly into your C codeThe C programming language code used to develop many of the core business functions (BSFNs) within the JD Edwards EnterpriseOne system. to bracket suspect logic blocks, such as a recursive cache searchA search operation that repeatedly calls itself to find data, often within JD Edwards' in-memory caches, which can impact performance if not optimized. or a complex F41021A standard JD Edwards database table that stores detailed information about item locations, quantities, and other inventory-related data. inventory update. By isolating these segments, you can establish a statistical baseline across 10–15 identical executions. This data-driven approach allows you to quantify a 15–20% reduction in execution time, providing the CIOChief Information Officer, a senior executive responsible for an organization's information technology strategy and implementation. with hard evidence of optimization rather than anecdotal assertions.
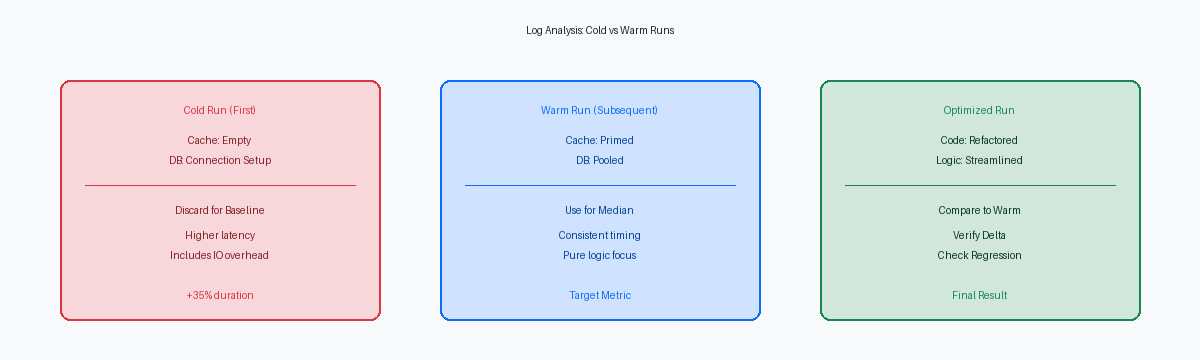
The Fallacy of Subjective Performance Testing
Starting a performance test by clicking a button and timing it on a phone is a waste of effort. A first-run execution of a master business functionA high-level JD Edwards business function that orchestrates and coordinates the execution of multiple other, smaller business functions to complete a complex task. like B4200310 often exhibits a 20–40% slower variance compared to subsequent runs. This delay isn't the code’s logic failing; it’s the tax of initial JDE cache loadingThe process of populating JD Edwards' in-memory data storage areas (caches) with frequently accessed information to improve application performance., populating the JDEBASE middlewareJD Edwards' proprietary data access layer that acts as an intermediary between the application logic and the underlying database, abstracting database interactions., and establishing the first database connection through the OCIOracle Call Interface, a powerful API that allows applications to interact directly with Oracle databases, providing high-performance data access. or ODBC driverAn Open Database Connectivity (ODBC) driver is a software component that enables applications to connect to and interact with various databases using a standard interface.. Measuring this first run as a baseline skews your optimization metrics before you've written a single line of C code.
Measuring performance at the application levelThe part of a software application that directly interacts with users and handles specific business processes, distinct from underlying technical layers. introduces too many variables that mask the actual BSFN execution timeThe total duration it takes for a specific JD Edwards Business Function (BSFN) to complete its processing, from start to finish.. Network latencyThe delay experienced when data travels across a network from one point to another, impacting the responsiveness of distributed applications., Web Server serializationThe process of converting data structures or objects into a format that can be easily transmitted over a network or stored, often by a web server., and UI renderingThe process by which a computer system generates and displays the graphical user interface (UI) elements on a screen for the user to interact with. can add 200ms to 500ms of noise to a transaction. When a developer claims they "felt" the application speed up, they are ignoring that the underlying BSFN might only represent a nominal fraction of that total round-trip time. Effective tuning requires isolating the logic from the presentation layerThe part of a software application responsible for displaying information to the user and handling user input, separate from the core business logic. to see what the CallObject KernelA server process in JD Edwards that executes business functions (BSFNs) and handles communication between the application and the database. is actually doing in the runtime environment.
Small efficiencies in BSFNs appear negligible in a single transaction but become critical in batch processingA method of running computer programs or jobs in groups (batches) without manual intervention, typically for large volumes of data or scheduled tasks.. Shaving approximately 50ms off a custom calculation BSFN called inside a loop of 10,000 records results in a nearly ten-minute reduction in UBEUniversal Batch Engine (UBE) is the JD Edwards component responsible for running batch reports and processes, often for large-scale data operations. processing time. In high-volume distribution environments where the R42565 Print Pick SlipsA specific JD Edwards batch report (UBE) used to generate and print pick slips, which are documents used in warehouses to fulfill sales orders. runs against thousands of lines, these micro-optimizations prevent the job queueA list of tasks or programs (jobs) waiting to be executed by a computer system, often managed by a scheduler in JD Edwards. from backing up during peak hours. Without hard data, a gain of approximately 50ms looks like a rounding error; in a massive loop, it is the difference between meeting or missing a shipping window.
Performance claims lacking log-based evidence are frequently dismissed during peer reviews or by CNC teamsConfigurable Network Computing (CNC) teams are JD Edwards system administrators responsible for installation, configuration, maintenance, and performance of the JDE environment. investigating kernel timeoutsWhen a JD Edwards server process (kernel) exceeds a predefined time limit for completing a task, leading to its termination and potential errors.. When a kernel hits a 600-second timeout and dies, the CNC team looks for repeatable, logged execution durations, not subjective observations from a UAT sessionUser Acceptance Testing (UAT) session, a phase where end-users test software to ensure it meets business requirements before deployment.. Providing a delta analysisThe process of comparing two sets of data or measurements to identify and quantify the differences or changes between them. based on microsecond-precision logs shifts the conversation from anecdotal to technical validation. Proving that a specific SQL statementA command written in Structured Query Language (SQL) used to communicate with and manage data in a relational database, such as SELECT, INSERT, UPDATE, or DELETE. or a recursive BSFN call was the bottleneck requires the precision that only raw log timings provide.
Configuring jdedebug.log for Microsecond Precision
Standard JDE logging is often dismissed as a blunt instrument, but the 6-digit microsecond timestamp in the jdedebug.logA detailed log file generated by JD Edwards, containing execution traces, SQL statements, and timestamps, crucial for debugging and performance analysis. header is the only reliable way to profile a BSFN execution path. When examining a Master Business FunctionA high-level JD Edwards business function that orchestrates and coordinates the execution of multiple other, smaller business functions to complete a complex task. like B4200310 that executes dozens of nested calls in one transaction, millisecond precision is insufficient. You need to see the exact microsecond a process hits the Entering JDE_FreeDataSelection marker to identify where the execution budget is actually being spent.
To get this granularity, set Output=FILE and DebugLevel=EXTENDEDA setting in the jde.ini file that increases the verbosity of the jdedebug.log, capturing more detailed execution information for debugging. in the jde.iniA crucial configuration file for JD Edwards EnterpriseOne, containing settings that control various aspects of the system's behavior and logging. [DEBUG] section. This ensures the engine captures the complete entry and exit stack of every nested BSFN. Without the extended level, the engine suppresses inner-loop timings that often hide bottlenecks, such as repeated calls to B9800100A common JD Edwards business function used for date conversions and other utility operations within the system. for date conversions. You are specifically looking for the "Enter BSFN" and "Return BSFN" lines to calculate the deltaThe difference or change between two values, often used in performance analysis to quantify improvement or degradation. between the call and the response.
Testing on a busy enterprise serverThe central server in a JD Edwards deployment where core business logic, batch processes (UBEs), and database interactions are executed. results in log interleavingWhen log entries from multiple concurrent processes or threads are mixed together in a single log file, making it difficult to follow a specific execution path., making the trace unreadable. You must isolate the test session to a single Call Object kernel. If you are running on a Linux or Windows enterprise server, use the Server ManagerA web-based tool in JD Edwards EnterpriseOne used by CNC teams to manage, monitor, and configure various components of the JDE environment. to lock the test user to a specific PIDProcess ID, a unique numerical identifier assigned by an operating system to each running process, used for management and monitoring.. This isolation ensures the wall-clock timeThe actual elapsed time as measured by a clock, including all waiting periods, in contrast to CPU time which only counts active processing. recorded reflects only the execution path of your specific transaction.
The 'Time' column in the log represents total wall-clock timeThe actual elapsed time as measured by a clock, including all waiting periods, in contrast to CPU time which only counts active processing. rather than pure CPU cyclesThe fundamental units of time or operations performed by a computer's Central Processing Unit (CPU), indicating processing activity.. This microsecond deltaThe difference or change between two values, often used in performance analysis to quantify improvement or degradation. includes wait states for database locksMechanisms used in databases to prevent multiple users or processes from simultaneously modifying the same data, ensuring data integrity., network latencyThe delay experienced when data travels across a network from one point to another, impacting the responsiveness of distributed applications. on synchronous callsA type of function call where the caller waits for the called function to complete its execution and return a result before continuing its own processing., and middleware overheadThe additional processing time or resources consumed by software that connects different applications, beyond the core business logic.. When you see a gap of several hundred milliseconds between a SELECTSELECT is an SQL command used to retrieve data from one or more database tables. and the subsequent FETCHFETCH is an SQL command used to retrieve rows from a result set, typically after a SELECT statement has been executed., you are looking at database contentionOccurs when multiple processes or users try to access or modify the same database resources simultaneously, leading to delays and performance issues. rather than slow logic. Accurate measurement requires you to subtract these external wait states to isolate the true execution time.
Injecting Custom Log Markers in C BSFNs
The standard JDE call stack in a debug log is often cluttered with thousands of lines of overhead, making it nearly impossible to isolate why a specific F0911A core JD Edwards database table that stores general ledger (GL) transactions, representing financial entries and accounting data. fetch is dragging down a post-version. While the log captures every JDB_FetchA JD Edwards API call used by business functions to retrieve data from a database table, typically after a JDB_Select operation. and BSFN boundaryThe defined start or end point of a Business Function's execution, often marked in logs to track its duration., it does not natively tell you where a specific 5,000-iteration loop begins or ends within a custom B55 functionA custom JD Edwards Business Function, typically developed by customers or consultants, with names often starting with 'B55' to denote custom code.. To solve this, developers must use the jdeWriteLogAn Application Programming Interface (API) in JD Edwards that allows developers to insert custom messages and timestamps directly into the jdedebug.log file. APIAn Application Programming Interface (API) is a set of rules and definitions that allows different software applications to communicate and interact with each other. to inject surgical markers directly into the output stream. This approach bypasses the noise of standard CALL and RET lines, allowing you to focus on the specific block of C code causing the bottleneck.
Inserting a line like jdeWriteLog(NULL, "PERF_START: F0911_Processor_Loop"); at the top of a processing block provides a grep-ready anchorA unique, easily searchable string or pattern embedded in a log file, designed to be quickly found using command-line tools like 'grep'. that is distinct from the 20MB of other data generated during a typical transaction. By pairing this with a corresponding PERF_ENDCustom log markers (e.g., "PERF_END") inserted into code to denote the end of a specific performance measurement interval. marker at the exit point, you create a measurable window within the log file. Using these unique prefixes ensures that even if you are analyzing a log with 500,000 lines, a simple command-line searchSearching for text or patterns using text-based commands in a terminal or command prompt, often with tools like 'grep'. or a basic Python scriptA program written in the Python programming language, often used for automation, data analysis, and parsing text files like logs. can extract the exact timestamps for the logic you are auditing. This method is far more reliable than trying to manually calculate the deltaThe difference or change between two values, often used in performance analysis to quantify improvement or degradation. between unrelated JDB_SelectA JD Edwards API call used by business functions to initiate a database query and select data from a table. calls.
Many developers attempt to use internal JDE timing structures or platform-specific C librariesCollections of pre-written C code that provide functions and resources for common programming tasks, used to build applications. to measure performance, but these often break during Tools Release upgradesUpdates to the underlying technical components and framework of JD Edwards EnterpriseOne, separate from application code updates. from 9.2.5 to 9.2.8 due to header file changesModifications to files (e.g., .h files in C/C++) that contain declarations for functions, variables, and data structures used in programming. or compiler shiftsChanges in the software (compiler) that translates source code into executable programs, which can sometimes require code adjustments.. Sticking to the standard logging API ensures your performance hooks remain portable across all 64-bit and 32-bit deploymentsRefers to the architecture of the operating system and software, impacting memory addressing and processing capabilities. without requiring additional include files or complex build configurations. It is a cleaner, more sustainable way to instrument code that will survive the next decade of Application UpdatesOfficial updates or patches released by Oracle for the JD Edwards EnterpriseOne application code, providing new features or bug fixes..
In a recent project involving a high-volume distribution client, we used these markers to identify a delay of approximately 400ms occurring inside a nested loop that was called 10,000 times per batch runA single execution of a batch process or Universal Batch Engine (UBE) job in JD Edwards, typically processing a large volume of data.. Standard logging showed the BSFN took over an hour to complete, but the custom markers pinpointed a redundant GetAddressBookConstantA JD Edwards business function used to retrieve specific constant values or settings related to the Address Book system. call within the loop as the culprit. Removing that single call reduced the total batch runtimeThe total time it takes for a batch process or Universal Batch Engine (UBE) job to complete its execution. by over three-quarters, a win that would have been obscured by the sheer volume of standard debug output.
Establishing a Statistical Performance Baseline
A single execution trace of a BSFN like F4211FSBeginDocA specific JD Edwards Master Business Function (MBF) used to initiate the creation or modification of a sales order. is an anecdote, not a metric. In a multi-tenant environmentA software architecture where a single instance of the software serves multiple distinct customers or organizations, sharing resources., transient network latencyThe delay experienced when data travels across a network from one point to another, impacting the responsiveness of distributed applications. or database contentionOccurs when multiple processes or users try to access or modify the same database resources simultaneously, leading to delays and performance issues. can double the execution time of a single call. To establish a reliable baseline, execute the same process a minimum of 10 times under controlled conditions. Calculate the median execution timeThe middle value in a sorted list of execution times, which is less affected by extreme outliers than the average (mean). rather than the meanThe average value of a set of numbers, calculated by summing all values and dividing by the count of values. to prevent a single spike from skewing the target. If you measure a B0100066A specific JD Edwards business function, often related to Address Book processing or retrieving address-related information. call at 150ms once and over 400ms later due to a temporary lock, the average is useless for tuning.
Discard outlier runsIndividual test executions whose performance measurements deviate significantly from the majority of other runs, often due to external factors. that coincide with heavy system activity. Developers often waste days debugging performance regressionsA decrease in the speed or efficiency of software performance, often occurring after code changes or system updates. that are actually just a full server package buildThe process of compiling, linking, and deploying JD Edwards code (like BSFNs and UBEs) to the enterprise server for execution. saturating the Enterprise Server's CPUThe Central Processing Unit (CPU) of the JD Edwards enterprise server, responsible for executing business logic and processing data. or a massive ESU deploymentThe process of applying an Electronic Software Update (ESU), which is a patch or fix released by Oracle for JD Edwards, to a system. hitting the database. Validate that system load is consistent across all 10 runs using Server Manager metricsPerformance and operational data collected and displayed by JD Edwards Server Manager, used to monitor system health and resource usage.. If a run deviates by more than 25%, check if a concurrent UBEUniversal Batch Engine (UBE) is the JD Edwards component responsible for running batch reports and processes, often for large-scale data operations. like R42520R42520 is a specific JD Edwards Universal Batch Engine (UBE) report, often used for sales update processing. was competing for resources.
Apples-to-apples comparisons require a frozen data setA fixed and unchanging collection of data used for testing to ensure consistent and comparable results across multiple performance runs.. If you are profiling F4211FSEndDocA specific JD Edwards Master Business Function (MBF) used to finalize the processing of a sales order., use a specific Sales Order with exactly 50 lines. Variations in the data render timing logs incomparable because the iterationIteration refers to the repetition of a process or a block of code multiple times, often for each item in a collection. logic inside the C code scales non-linearly. Document the specific Order Number and TypeKey identifiers in JD Edwards used to uniquely identify and categorize sales orders or other transaction documents. to ensure subsequent optimization passes hit the same code paths.
Measuring performance inevitably alters the results. Enabling jdedebug.logA detailed log file generated by JD Edwards, containing execution traces, SQL statements, and timestamps, crucial for debugging and performance analysis. introduces a measurable overheadThe additional processing time or resources consumed by monitoring, logging, or other non-core activities, which can be quantified., typically adding 2% to 5% to the total execution time. This penalty is non-negotiable for microsecond precision, but must be factored into the final report. When you present a 20% improvement in speed, clarify that this deltaThe difference or change between two values, often used in performance analysis to quantify improvement or degradation. holds true even when logging is disabled in production.
Analyzing Log Timings and Calculating Delta
The jdedebug.logA detailed log file generated by JD Edwards, containing execution traces, SQL statements, and timestamps, crucial for debugging and performance analysis. is a firehose, but the Call Object kernel provides the specific breadcrumbs needed for timing. Look for the "Entering JDERTJD Edwards Runtime, referring to the execution environment and framework within which JD Edwards business functions and applications operate.: [Function Name]" and "Exiting JDERTJD Edwards Runtime, referring to the execution environment and framework within which JD Edwards business functions and applications operate.: [Function Name]" markers. Subtracting the PERF_STARTCustom log markers (e.g., "PERF_START") inserted into code to denote the beginning of a specific performance measurement interval. timestamp from the PERF_ENDCustom log markers (e.g., "PERF_END") inserted into code to denote the end of a specific performance measurement interval. timestamp gives you the raw execution duration. In a 9.2 environment, these timestamps are logged in microseconds, allowing you to catch micro-latenciesVery small, often imperceptible, delays in system operations, measured in microseconds, which can accumulate to significant total time. that aggregate into minutes over a batch runA single execution of a batch process or Universal Batch Engine (UBE) job in JD Edwards, typically processing a large volume of data. of 50,000 records.
Raw duration is often a deceptive metric when dealing with complex logic like B4201500A specific JD Edwards business function, often a Master Business Function, involved in complex sales order processing or related logistics.. If the function runs for several hundred milliseconds but calls GetItemPriceA JD Edwards business function used to retrieve the pricing information for a specific item, considering various pricing rules and adjustments. twenty times, the bottleneck might not be the parent logicThe main part of a program or function that calls and controls the execution of other sub-functions or modules.. You must subtract the cumulative duration of all child BSFN callsBusiness functions that are invoked or called by another, higher-level (parent) business function as part of a larger process. from the total parent time to isolate the Self TimeThe amount of time a function spends executing its own code, excluding the time spent in any other functions it calls.. This distinction is critical; optimizing a parent function when the vast majority of the latency resides in a nested F4101A core JD Edwards database table that stores the Item Master information, including details about each inventory item. fetch is a waste of development hours.
Manually parsing a 2GB log file is a recipe for error. Use Notepad++A popular free source code editor and Notepad replacement that supports several programming languages and offers advanced text editing features. with the Compare pluginAn add-on for text editors like Notepad++ that allows users to compare two files side-by-side and highlight their differences. to spot deviations between runs, or a Python scriptA program written in the Python programming language, often used for automation, data analysis, and parsing text files like logs. using regular expressionsA sequence of characters that defines a search pattern, primarily used for string matching and manipulation. to parse the PIDProcess ID, a unique numerical identifier assigned by an operating system to each running process, used for management and monitoring. and thread IDA unique identifier assigned to a thread, which is a single sequence of execution within a process, allowing for concurrent operations.. A script can iterate through the log, push timestamps into a stack for nested calls, and output a CSVComma Separated Values, a simple file format used to store tabular data, where each line represents a data record and fields are separated by commas. of every BSFN execution with its dedicated Self Time. This transforms a subjective complaint into a ranked list of the top ten most expensive functions.
Focusing on the Entering and Exiting lines ensures you measure JDE runtimeThe execution environment and framework within which JD Edwards business functions and applications operate. and BSFN logic, rather than just SQL executionThe process of running Structured Query Language (SQL) commands against a database to retrieve, insert, update, or delete data.. In a recent migration, this delta analysisThe process of comparing two sets of data or measurements to identify and quantify the differences or changes between them. revealed a custom BSFN performing 3,000 redundant cache lookupsThe act of searching for data within an in-memory cache, which is typically much faster than retrieving it from a database or disk. per transaction. These were invisible in UBE completion timesThe total duration from the start to the end of a Universal Batch Engine (UBE) job in JD Edwards. but obvious once nested durations were subtracted. Correcting the logic reduced the total job duration from four hours to less than thirty minutes.
Validating the Optimization and Claim Limits
An optimization shaving approximately 50ms off a Sales Order Entry (P42101)P42101 is a specific JD Edwards application, often a version of Sales Order Entry (P4210), used for managing sales orders. BSFN call is statistically irrelevant if your baseline jitterThe natural, small variations or fluctuations observed in performance measurements even under consistent conditions, representing system noise. is roughly ±75ms. You must run at least 10 iterations of the process in a controlled environment to establish a standard deviationA statistical measure that quantifies the amount of variation or dispersion of a set of data values around the mean. threshold. If the average performance gain does not exceed this variance, you have not optimized the code; you have simply captured a favorable slice of CPU schedulingThe process by which an operating system determines which processes or threads get access to the Central Processing Unit (CPU) and for how long. or cache hitsOccurs when requested data is found in a cache, resulting in faster access compared to retrieving it from a slower storage location.. Validating the deltaThe difference or change between two values, often used in performance analysis to quantify improvement or degradation. against the noise of the system prevents the team from chasing phantom improvements that disappear the moment the system hits 60% concurrent user loadA scenario where 60% of the maximum expected number of users are actively using the system at the same time, testing system capacity..
Senior developers often fall into the trap of over-engineering C codeDesigning C code with excessive complexity or features beyond what is necessary, often leading to increased maintenance and potential issues. to squeeze out a nominal 10ms saving. Replacing a readable Select and Fetch NextIn database operations, 'Select' is an SQL command to retrieve data, and 'Fetch Next' retrieves the subsequent row from the result set. loop with complex custom pointersVariables in C/C++ that store memory addresses, allowing direct manipulation of memory, often used for advanced data structures. or manual memory managementThe explicit allocation and deallocation of computer memory by a programmer, rather than relying on an automated system. might reduce execution time by a negligible amount, but it doubles the time required for the next consultant to debug a memory leakA software defect where a program fails to release memory it no longer needs, leading to gradual consumption of available memory and system slowdowns.. If the BSFN is called once per transaction, the maintenance burdenThe ongoing effort, time, and resources required to keep software functional, updated, and free of defects. of hyper-optimized code far outweighs the fractional gain in throughputThe rate at which a system, process, or network can successfully process or transmit data or transactions over a given period.. Save aggressive logic for functions inside the inner loopA programming loop that is nested inside another loop, meaning it executes multiple times for each iteration of the outer loop. of a high-volume UBEUniversal Batch Engine (UBE) is the JD Edwards component responsible for running batch reports and processes, often for large-scale data operations. or an AIS orchestrationApplication Interface Services (AIS) orchestration in JD Edwards is a framework for creating automated, multi-step integrations and process flows. processing thousands of records per hour.
Performance gains are rarely linear across different data sets. A logic change that speeds up a single-line inventory adjustment may actually degrade performance when processing a 1,000-line EDI purchase orderAn Electronic Data Interchange (EDI) purchase order is a standardized electronic document used for automated business-to-business purchasing. if the new code introduces O(n²) complexityA measure of algorithm efficiency where the execution time grows proportionally to the square of the input size (n), indicating potential slowdowns with large data.. You must verify the optimization at both ends of the spectrum: the typical 10-line transaction and the edge-case 1,000-line batch. Use log timings to confirm that the time per record remains stable or improves as the volume scales, ensuring the fix does not become a bottleneck during month-end processingA set of critical business and accounting tasks performed at the end of each month, often involving large data volumes and strict deadlines..
Record the specific performance metrics in the BSFN source headerThe initial section of a Business Function's source code file, typically containing comments, metadata, and documentation about the function. and the OWM project notesDocumentation or comments stored within the Object Workbench Manager (OWM) in JD Edwards, used to track development project details. once the optimization is verified. Document the baseline average, the optimized average, and the test conditions used, such as a 1,000-line batch dropping from approximately 40 seconds to 30 seconds. This provides the CNC team and future developers with a clear benchmarkA standard or point of reference against which the performance or quality of something can be measured and compared., preventing them from accidentally regressing the performanceWhen the performance of a system or application deteriorates, often after a change or update, returning to a previous, slower state. during a future ESU retrofitThe process of reapplying an Electronic Software Update (ESU) to custom JD Edwards code after a system upgrade or modification. or a Tools Release upgradeUpdates to the underlying technical components and framework of JD Edwards EnterpriseOne, separate from application code updates.. Clear documentation turns a one-time fix into a permanent architectural assetA valuable and well-designed component or principle within a system's architecture that contributes to its long-term stability, performance, or maintainability..
This guide on profiling BSFN performance through log analysis and precise timing is part of a series on JDE development technical standards. If these techniques resonate for your current optimization project, I encourage you to review other articles here covering JDE Cache patternsEstablished design principles and best practices for effectively utilizing JD Edwards' in-memory data caches to optimize application performance. and SQL optimizationThe process of improving the performance of Structured Query Language (SQL) queries to make them run faster and use fewer resources..
