




A custom inventory allocation BSFNA Business Function is a reusable piece of code in JD Edwards used to perform specific tasks or calculations. processing 10,000 to 15,000 sales order lines should execute in under a minute. Yet, in many JDE 9.2 environments, this exact run takes over half an hour because of a classic anti-pattern: executing repetitive Select and Fetch Next statements on F4101 or F4102 inside a loop. When a Named Event Rule (NER)A JD Edwards-specific programming language that allows developers to create business logic without writing C code. or C business function fires a database roundtrip for every single iteration, the network latency between the Enterprise ServerThe central server in a JD Edwards architecture that processes business logic and manages communication with the database. and the database tier severely degrades performance.
Fixing this bottleneck requires more than just adding SQL Server or Oracle DB indexes. True JDE BSFN performance tuning to reduce table I/OThe process of reading from or writing data to database tables. in loops demands architectural shifts, specifically replacing row-by-row database I/O with JDE user cache APIs (like jdeCacheInitA technical command used to initialize a temporary storage area in the server's memory for faster data access.) or prefetching data into memory. By staging master data in memory once, you eliminate thousands of redundant SQL executions and drop execution times by 90% to 95%.
The Hidden Cost of Nested Table IO in Loops
In a standard Sales Order Entry (P42101) or customized batch post-processing UBEUniversal Batch Engine, the JD Edwards tool used to run background reports and automated batch processes., developers frequently nest database lookups inside a driver loop. Every single JDB_FetchKeyed or select statement executed inside that loop triggers an individual network roundtrip and database parse phase. This architecture compounds latency exponentially because the middleware must negotiate a full request-response cycle for every row, even if the database server has cached the execution plan.
Consider a scenario processing a batch of 5,000 to 10,000 records, such as daily inventory adjustments in F4111. If the business function performs several single-row table lookups—for instance, checking item branch parameters in F4102, unit of measure conversions in F41002, and location details in F41021—the loop executes tens of thousands of distinct database operations. This volume of chatty traffic quickly saturates the network card and can paralyze the CallObject kernelA specialized process on the Enterprise Server responsible for executing business functions requested by users or batch jobs., leaving it in a prolonged wait state while users experience interactive application hangs.
Infrastructure teams often attempt to resolve this performance degradation by rebuilding SQL indexes or adjusting database memory pools. While proper indexing optimizes raw disk read speeds, it does nothing to mitigate the physical network latency or the CPU context switchingThe process of a computer's CPU switching between different tasks or processes, which can cause overhead if done too frequently. that occurs between the Enterprise Server and the database server. The bottleneck is not the database's ability to find the row; it is the sheer volume of context switches the CallObject kernel must perform to initiate, execute, and close thousands of discrete JDB API calls.
Before writing another line of C code or NER, profile the transaction density. If your execution log shows thousands of sequential SQL queries for a single interactive transaction, you must refactor the logic to load static tables into memory once.
Measuring the Overhead with Performance Workbench
Never refactor a line of C code or Named Event Rule (NER) based on a hunch about which table is dragging down system performance. To isolate the actual root cause, modify your local jde.ini file, navigating to the [DEBUG] section and setting Output=FILE alongside Keep logs=0 to capture a clean execution path. Running the target UBE or interactive application under this state generates a detailed jdedebug.log file that can easily exceed several gigabytes, mapping every single database API call, business function boundary, and SQL statement executed by the call object kernel.
Feeding this large log file into the Oracle Performance WorkbenchAn Oracle utility used to analyze JD Edwards debug logs and identify performance bottlenecks in code and SQL. utility allows you to parse millions of lines of raw trace data in minutes. The tool aggregates the performance metrics, specifically isolating the exact duration of JDB_SelectKeyed, JDB_Fetch, and JDB_OpenTable API calls. It ranks these database operations by cumulative execution time, immediately exposing which tables, such as a custom F551101 tag table, are generating disproportionate database round-trips during processing.
A common diagnostic mistake is looking only for heavy, long-running SQL statements that take several seconds to execute. In loop-based bottlenecks, you will see the exact opposite: a single SELECT statement on F4101 that runs in under a millisecond, but has an execution count in the tens of thousands. This high execution count with low individual duration is the definitive signature of a loop-based I/O bottleneck. Identifying this pattern tells you precisely where to replace repetitive database fetches with a memory-based caching strategy before promoting the code to the PY environmentThe Prototype environment in JD Edwards, used for testing new code and configurations with production-like data..
Implementing JDE Cache for Static Master Data
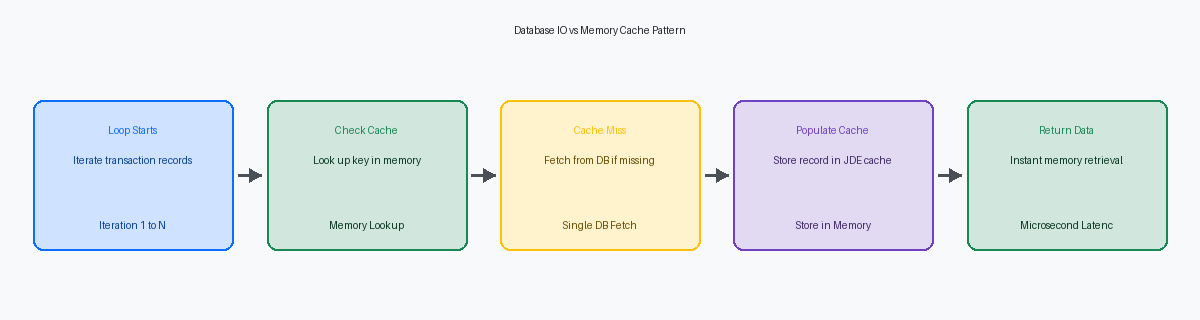
A custom sales processing UBE handling tens of thousands of order lines shouldn't execute tens of thousands of separate SQL SELECT statements against the F4101 for the same few hundred fast-moving items. For static or semi-static tables like the F4101 Item Master or F0010 Company Constants, loading the data into a JDE User Cache once per transaction eliminates database roundtrips entirely. This shifts the performance bottleneck from database I/O latency—which typically consumes 2 to 5 milliseconds per query over the network—to memory-speed lookups measured in microseconds. In a standard 3-tier architecture, this local caching prevents network serialization delays between the enterprise server and the database engine.
The JDE Cache API functions like jdeCacheInit, jdeCacheAdd, and jdeCacheFetchPosition store structured records directly in the CallObject kernel's memory space. When a C business function initializes a cache, it defines a unique key structure matching the target table's indices, such as short item number (ITM) and branch/plant (MCU). Subsequent lookups bypass the database middleware entirely, retrieving the pre-loaded F4101 data structure directly from local RAM. This architecture scales linearly, maintaining sub-millisecond response times even under a load of several hundred concurrent HTML sessions.
Speed gains are worthless if your enterprise servers crash due to memory exhaustion. Developers must implement a strict cleanup pattern using jdeCacheTerminate in the BSFN's destruction block to prevent memory leaks in the JDE middleware. If a CallObject kernel processes thousands of transactions without terminating its cache instances, these orphaned memory segments will accumulate. This eventually forces an administrative kernel recycling event, dropping active user sessions during peak operational hours. Always pair every jdeCacheInit with a corresponding termination call in the same execution thread.
The Prefetch Pattern for One-to-Many Relationships
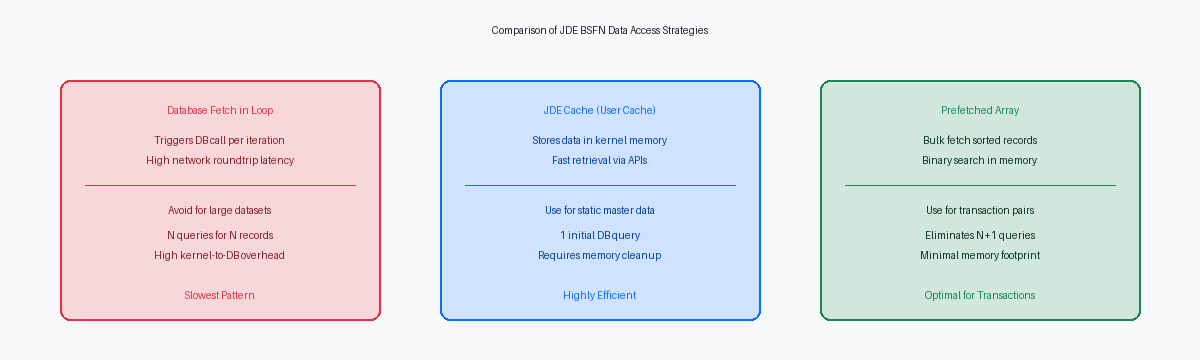
Processing thousands of F4211 detail lines by querying the F4201 header table inside the loop is a classic performance killer that occurs in a significant majority of custom shipment confirmation or invoicing UBEs, in our experience around three-quarters. This N+1 query patternA performance problem where one initial query triggers many subsequent queries in a loop, leading to excessive database traffic. generates thousands of individual round-trips to the database, inflating execution times from seconds to minutes. Prefetching parent F4201 records in bulk before entering the detail loop eliminates this chatty database traffic entirely.
Instead of executing JDB_FetchKeyed inside the F4211 loop, extract the unique list of document numbers (DOCO), types (DCTO), and companies (KCOO) first. You then run a single SELECT statement with an IN clause—or utilize a partial key join—to load these F4201 header records into a sorted memory array or a lightweight JDE user cache. For a typical batch of 200 to 500 sales orders, this replaces thousands of individual database select statements with a single, highly optimized index scan on the primary key of the F4201.
Once the header data resides in local memory, search performance scales logarithmically rather than linearly. Iterating through the sorted memory array using a binary search algorithm, such as the standard C library bsearch function, reduces lookup latency from 2 to 5 milliseconds per database fetch down to less than a microsecond. If you are processing a high-volume EDI interface with tens of thousands of lines, this prefetch optimization cuts UBE runtimes by 80% to 90%, dropping execution times from several minutes to under two minutes without changing a single index on the database.
Refactoring NER to C BSFN for Memory Control
Named Event Rules (NER) are a major bottleneck in high-volume processing because they lack direct access to JDE Cache APIs. When developers need to store temporary transactional state across iterations in an NER, they are forced to use inefficient workarounds like custom work tables (e.g., a custom F5501UI table) or repeated database views. This design pattern introduces heavy disk I/O and database locks, turning what should be a sub-millisecond memory lookup into a multi-millisecond physical database hit for every single loop iteration.
Converting these high-frequency NERs to C business functions resolves this limitation by providing native pointer manipulation, custom structure definitions, and direct memory management. Instead of letting the Toolset generate bloated, unoptimized C code behind the scenes, writing native C allows you to allocate memory dynamically using jdeAllocA JD Edwards API function used to allocate a specific amount of memory on the server for use by a business function. and define precise structures that mirror your business logic. This transition typically reduces CPU utilization on the enterprise server by 40% to 60% for batch jobs processing large datasets like the F4211 or F4111.
The real architectural advantage of a C BSFN is its ability to maintain state across multiple calls using the lpDs->hUser or lpVoid pointers. In a typical multi-step UBE execution, you can initialize a JDE cache in the first call, store the memory address of that cache bucket in the user-reserved pointer, and retrieve it instantly in subsequent detail-processing calls. This eliminates the overhead of searching the global cache list by name on every invocation, allowing persistent cache access across different execution steps without a single database round-trip.
Validating the Performance Gains in PY Environments
Running performance validation in a local Development (DV) environment with a truncated database is a waste of time. To capture realistic network and database latency, you must execute these validation tests in a Prototype (PY) environment that contains a restored, production-sized database. Without the physical distance between the enterprise server and the database server, and without production-scale tables like the F0911 or F4211, your local cache hits will mask the real-world latency that occurs when thousands of concurrent users are hitting the system.
To establish a clean baseline, construct a simple, standardized UBE driver—such as a custom R5501I6 report—designed to run the target business function sequentially over a batch of 5,000 to 10,000 records. Run this driver once using the legacy BSFN configuration, clear the JDE database cache via Server Manager to prevent cached results from skewing the next run, and then execute the same driver with your refactored code. This head-to-head comparison isolates the business logic execution from interactive APPL screen rendering times, giving you clean, unvarnished log files in the print queue.
A successful cache-based or prefetch refactoring must yield a 90% to 95% reduction in database execution time to be considered complete. In a recent optimization of an F41021 item availability loop during a 9.2 upgrade, this specific approach dropped the total BSFN execution time from over ten minutes down to under half a minute for a block of 10,000 rows. When you eliminate thousands of individual SQL SELECT statements and replace them with memory-pointer lookups, the database CPU utilization flatlines, and the network transport overhead drops to near zero.
If your custom code estate exceeds several thousand objects, the cumulative drag of inefficient Table I/O within BSFN loops can easily account for a significant portion of UBE execution time, in our experience around a third to half.
