
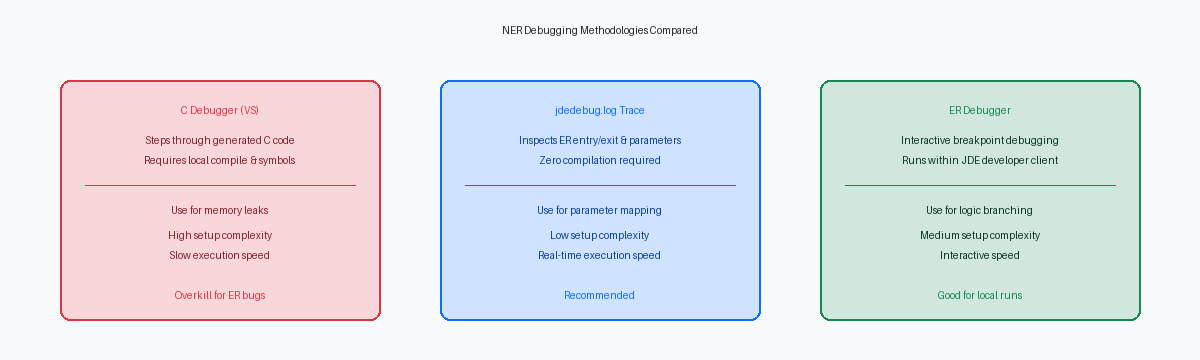
Spinning up a C debugger like Microsoft Visual Studio to step through a Named Event Rule (NER) is often unnecessary and time-consuming. For most JD Edwards developers, a more efficient approach to JDE NER debugging involves tracing event rules triggered directly from an application call using the runtime engine's native logging capabilities. By systematically analyzing the call stack, parameter mappings, and return codes within the local debug log, you can rapidly isolate the root cause of transactional failures without the overhead of compiling debug symbols or attaching external processes.
The APPL-to-NER Interface: Mapping the Call Stack
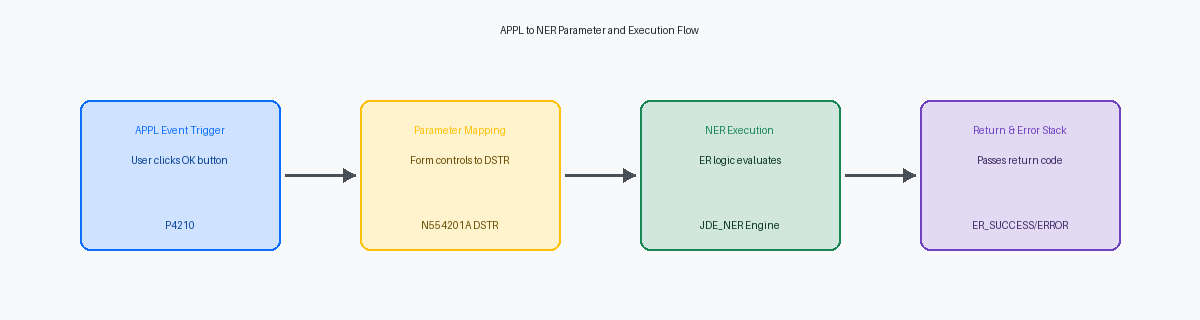
When a user clicks the OK button on the Sales Order Entry application (P4210), the runtime engine executes a complex call stack, often triggering 30 to 60 nested Business Function (BSFN) and Named Event Rule (NER) calls within a single transaction boundary. If your custom logic fails during this process, finding the root cause requires mapping the exact sequence of the NER call inside the APPL's Event Rules (ER). Developers often waste hours combing through log files when they should first isolate the specific event—such as Post Button Clicked or OK Button Clicked—where the custom NER is registered.
Interactive applications pass values to NERs using a specific Data Structure (DSTR) template, which in this scenario is a multi-parameter custom structure (D554201A) called by the custom NER N554201A. A common point of failure is a mismatch between the Form Control (FC) or Grid Column (GC) data types in the APPL and the corresponding elements in the NER's template. For example, mapping a 40-character string Form Control to a 30-character Data Structure member (like SZALPH) results in silent memory truncation or, worse, a memory initialization violation that crashes the call object kernel on the enterprise server.
To prevent these alignment errors, always verify the parameter mapping in the Event Rules Design (ERD) tool before generating the custom NER. If you modify a Data Structure to add an additional parameter, JDE does not automatically update the existing mappings in the APPL; it leaves them unmapped or misaligned. Re-aligning these variables manually in the APPL's ER editor and performing a local generation is the only way to guarantee that the runtime engine correctly pushes the parameters onto the execution stack.

Configuring the Runtime Trace for Clean Log Capture
A standard local web client session running on a fat client can easily generate tens of megabytes of log data per minute, making precise configuration of the local jde.ini critical before you trigger your target application. If you leave the default settings wide open, the system floods the log with background middleware chatter, burying the specific Named Event Rule execution you need to analyze. To isolate the execution path, navigate to the [DEBUG] section of your local jde.ini file.
Within this [DEBUG] section, setting Output=FILE and DebugLevel=EXT is the baseline requirement for capturing the granular entry and exit points of the NER engine. The EXT value ensures that the JDE runtime logs the exact parameters passed into the business function data structure, along with the values returned upon execution. Without this level of detail, you only see that the function was called, but you miss the critical state changes of the variables.
To keep the log readable, you must explicitly disable unnecessary tracing components that pollute the output. Turn off SQL tracing by setting LogSQL=0 in the [DB SYSTEM SETTINGS] section, and ensure security kernel tracing is disabled. Eliminating these database fetch details reduces log bloat by approximately two-thirds, keeping your focus entirely on the Event Rules execution flow and the call stack.
A reliable approach is to use the JDE AppControl utility or manually toggle the debug log active state right before you click the specific button or exit that triggers the application event. Active debugging should only run for the 3 to 5 seconds it takes to execute the target business logic. Toggling the log dynamic state via the runtime API or a local utility keeps your trace file under 5 to 10 megabytes, allowing you to open it instantly in any text editor without crashing the application.
Isolating the NER Entry and Exit in jdedebug.log
Isolating a custom Named Event Rule within a large log file, often several hundred megabytes in size, requires immediate, surgical filtering. If you search for the string Entering JDE_NER: N554201A, you will pinpoint the exact millisecond the runtime hands off execution from the interactive application to your custom sales processing logic. This entry point is accompanied by a specific identifier, such as thread ID 4512, which acts as your anchor. You must isolate this specific thread immediately; otherwise, interleaved logs from asynchronous business functions, background UBEs, or system subroutines running on parallel threads will corrupt your analysis of the execution path.
Once you isolate thread 4512, the JDE runtime exposes the call stack depth using nested level indicators like --> for entry and <-- for exit. Each nested level represents a step deeper into the execution hierarchy, such as when N554201A calls standard sales master business functions like B4200310. Counting these arrow indicators allows you to map the exact parent-child relationship of the business functions without guessing. When you find the corresponding Exiting JDE_NER: N554201A marker on that same thread, you have successfully bracketed the execution window for that specific call.
Comparing the timestamp differences between these entry and exit markers is the fastest way to diagnose performance degradation. A single execution of N554201A should process in under 50 to 100 milliseconds, but if the delta between the entry and exit markers stretches to several seconds, you are looking at a critical bottleneck. This lag typically points to unindexed custom fetches inside a Select/Fetch Next loop or repetitive, redundant table I/O operations inside the event rules. By calculating these deltas across multiple iterations in the log, you can prove whether a performance issue is systemic or tied to a specific data payload.
Inspecting Parameter Mappings and Data Structures
The exact state of your data structure at the moment of execution is laid bare in the jdedebug.log immediately following the Entering JDE_NER line. The engine dumps every member of the target data structure, showing you exactly what the calling APPL pushed onto the stack. If you are troubleshooting a calculation that fails only when run from a specific power form, this dump is where you isolate the delta between expected and actual inputs.
A frequent culprit in these dumps is a MATH_NUMERIC parameter that arrives as an uninitialized blank string rather than a clean zero. In C-based business functions and NERs, a blank in a math structure does not default to zero; instead, it bypasses initialization logic, causing downstream mathematical operations to fail silently or throw memory violations. When you inspect the log, look for a line like IN [1] <Math Numeric> : [] which confirms the calling application failed to initialize the variable before passing it to the data structure.
Character fields like EV01 flag parameters require the same scrutiny. An APPL might pass a lowercase 'y' instead of an uppercase 'Y', or a character field might contain a trailing space that slips past basic validation rules. The trace log exposes these literal values inside brackets, making it easy to spot if a conditional statement inside the NER is failing simply because it evaluated 'y' == 'Y' as false.
Before scrolling past the call block, trace down to the corresponding Exiting JDE_NER line to verify the outgoing parameters. If the internal logic executed successfully, the log must show the output parameters populated with their new values immediately prior to this exit marker. If the outputs remain blank or unchanged despite the logs showing no database errors, your issue lies in the conditional routing of the NER's internal event rules, not the database layer.
Tracking Return Codes and Error Stack Propagation
An NER communicates its execution status to the calling APPL through a strict return value protocol: ER_SUCCESS (0) indicates clean execution, while ER_ERROR (2) signals a hard failure. When a validation fails inside the NER, the engine does not automatically halt the calling application's event rules unless this return code is explicitly evaluated by the caller. In the jdedebug.log, you will see this manifest immediately after the Return value is line of the BSFN execution block, where a 2 indicates the calling form must halt its commit sequence.
Inside the generated C code of the NER, native Event Rules like "Set Action Error" map directly to the JDE engine's error stack APIs. When tracing a validation failure, search the log for the COB0000012 tracking line or the jdeErrorSet API call, which registers the specific Data Dictionary item—such as 0002 for "Record Invalid"—directly into the thread's memory. The log line will explicitly output the target DD item and the associated table or alias, confirming that the business function successfully registered the error even before control returns to the interactive runtime.
A common pitfall occurs when the calling APPL suppresses or fails to evaluate this return code, leading to a silent failure where the screen freezes without displaying the standard red error text. This mismatch happens because the error stack contains the registered DD item 0002, but the form's control flow bypasses the error display logic due to an unmapped return variable in the APPL's Event Rules. To resolve this, verify that the calling event rules check the BSFN's return pointer and explicitly trigger a Set Action Error at the control level if the NER returns 2.
Rebuilding and Deploying the Fixed NER via OWM
When you find the alignment bug in your custom Sales Order Entry NER, say N554201A, you cannot just save and exit the Event Rules designer. JDE developers often forget that saving ER only updates the specifications; you must explicitly trigger the generation process inside Object Management Workbench (OWM) to translate those visual rules into actual n554201a.c and n554201a.h source files. If you skip this generation step, the compiler will build the old C code, completely ignoring your visual ER modifications.
After generation, execute a local build of the business function within OWM to compile the new C code into your local development environment's runtime directory, which is critical if you are running a 64-bit Tools Release like 9.2.6. To test this change locally on your development client, you must bypass the local spec caching mechanism. Delete the local spec.db file located in your local path code directory (typically under E920\DV920\spec\) and restart your local Web Dev client to force EnterpriseOne to serialize the newly compiled specifications.
Once local validation succeeds, promote N554201A through OWM to your testing project status, typically status 26 for QA. You must run a selective update package build for your target path code, such as PY920, and deploy it to both the Enterprise Server and the HTML Server instances. Skipping this deployment step is the single most common cause of "works on my machine" syndrome, where the enterprise server continues executing the stale cached DLL or shared library, leading to immediate runtime failures.
Mastering the call stack and interpreting jdedebug.log output is essential when troubleshooting complex NER logic in Tools Release 9.2.8 and beyond. By systematically isolating thread IDs, verifying parameter mappings, and monitoring the error stack, developers can resolve integration bottlenecks and ensure transaction integrity across the enterprise.
