




When a batch queue locks up on the Enterprise ServerA central server in JD Edwards that executes business logic, database queries, and batch processes. at 2:00 AM, the immediate reflex for many teams is to increase max concurrent jobs in the JDE environment configuration. Nine times out of ten, that misdiagnoses the problem. The real bottleneck is almost always a flawed Report Design Aid (RDA)The JD Edwards tool used to design and customize reports and batch processes. layout executing millions of unindexed database fetches. Joining the F4111 Item Ledger to the F0911 General Ledger in a single custom Business ViewA JD Edwards object that defines relationships between tables and selects specific columns for reports and applications. without strict index matching turns what should be a 90-second batch run into a 4-hour queue lockup.
Mastering JDE UBE custom report design to avoid long running jobs requires addressing root-cause Event RulesThe proprietary scripting language used in JD Edwards to add custom business logic to applications and reports. logic long before code reaches your Package BuildThe process of compiling and assembling JD Edwards code into deployable packages for testing or production. pipeline. Pushing row-level I/O out of the Do Section, pruning unneeded table columns from Business Views, and properly releasing C BSFNC Business Function, a compiled C program used in JD Edwards to execute complex, high-performance business logic. memory handles regularly cuts UBEUniversal Batch Engine, the JD Edwards background process engine that runs reports and batch jobs. processing times by 80% to 95%. Here is the technical audit checklist to run against custom reports before promoting them out of the Development (DV) pathcode.
Optimize Business Views to Reduce Query Footprint
Developers routinely grab standard business views like V0911A or build custom views that SELECT all 120+ columns of the F0911 Account Ledger alongside the F0006 Business Unit Master. When processing 5 million transaction records, dragging F0911.GLPOST, F0911.GLALT1, and dozens of unused audit fields across the wire degrades memory performance on the Enterprise Server and swamps the database network interface. JDE generates SQL using an explicit column list based on the BSVW definition, but a view with over 100 fields across two tables still inflates memory allocations for every row buffer in the UBE runtime.
The performance drop compounds when developers configure left outer joins between F0911 and secondary tables like F0006 or F4111 using non-indexed primary key combinations or loose join criteria. Joining on unindexed fields forces the database query optimizer into a full table scanA slow database operation where the engine reads every single row in a table to find matching records. or high-cost hash join across millions of records, completely bypassing composite indexA database index created on multiple columns to speed up complex queries. F0911_1 (GLDCT, GLDOC, GLKCO, GLDGJ, GLJEL). On an Oracle Database 19c instance, a query structured this way regularly swells UBE execution time from under a minute to well over two hours.
Build a dedicated, minimal Business View in Object Management Workbench (OMW)The central development and change management application within JD Edwards. containing only the precise primary keys and target fields needed for filtering or processing. If your report only requires GLAID, GLAA, and GLDGJ from F0911 to compute general ledger balances, exclude all other columns from the view. Trimming a view from 120 fields down to 10 cuts the SQL network payload per row by roughly three-quarters and enables the database to keep index blocks cached far more efficiently during batch execution.
Align Data Selection and Indices for Instant Lookup
Drop a query onto an F4111 Item Ledger table containing 10 million rows without matching the leading columns of an index, and the database optimizer falls back to a full table scan or an expensive index skip scan. Custom inventory reports frequently select on transaction date (ILGLDATE) and branch/plant (ILMCU) while omitting item number (ILITM), driving runtime from a few seconds up to 45 minutes. RDA Data Selection must strictly mirror the left-to-right column sequence of an index key to allow the database optimizer to execute a direct index range scan rather than parsing millions of unindexed blocks.
Comparison operators in Report Design Aid dictate whether the database engine uses an index or evaluates records row-by-row. Using NOT EQUAL TO, CONTAINS, or WILD CARD criteria in RDA Data Selection suppresses index optimization by forcing full scans on the target table. When querying high-volume tables like F4111 or F4011, replacing a NOT EQUAL TO operator on document type (ILDOTY) with an explicit positive list—or filtering out unwanted document types in Event Rules after the record fetch—frequently reduces database I/O wait times by 80% to 90% on Oracle or SQL Server.
Runtime dynamic sorting is another silent killer of batch execution. When an event rule or report section specifies Data Sequencing that does not match an active database index, EnterpriseOne appends an ORDER BY clause that forces the database to write intermediate result sets to temporary tablespaces before returning the first row. Creating a targeted custom table index in Object Management Workbench (OMW) that precisely matches both your RDA Data Selection and your required Data Sequencing layout eliminates runtime sorting overhead, enabling the UBE engine to stream pre-sorted records instantly.
Eliminate Low-Efficiency ER Logic and Clause Traps
Filtering records using Event Rules logic in the Do Section forces the enterprise server to fetch every single record from the database tier before evaluating it. If a transaction detail report scans 500,000 non-matching rows on the F4111 cardex and suppresses them using a Suppress Section Write system function inside an ER IF/ELSE block, you still pay the full DB buffer and network latency penalty for all 500,000 rows. The database engine remains completely blind to your evaluation criteria, streaming gigabytes across the wire only for the JDE runtime to throw them away line by line.
Push that filtering logic up into the SQL engine by invoking Set User SelectionA JD Edwards system function used to dynamically filter database queries in reports. in the Initialize Section. System functions executed during initialization translate directly into SQL WHERE clause predicates in the initial query payload sent to Oracle Database or SQL Server. Evaluating conditions at the database level allows the query optimizer to utilize existing composite indexes, returning only the 20,000 relevant rows to the enterprise server and eliminating over 90% of the network and memory overhead instantly.
Be precise when managing dynamic user selection logic to prevent clause stacking. Calling Set User Selection repeatedly across logic branches without setting Set Selection Append Flag to specify replace mode forces JDE to concatenate redundant predicates into the generated statement. A report running in a loop that continuously appends AND clauses can easily construct a 2,000-character WHERE clause with redundant conditions, confusing the database optimizer and degrading an otherwise instant index lookup into a multi-hour batch bottleneck.
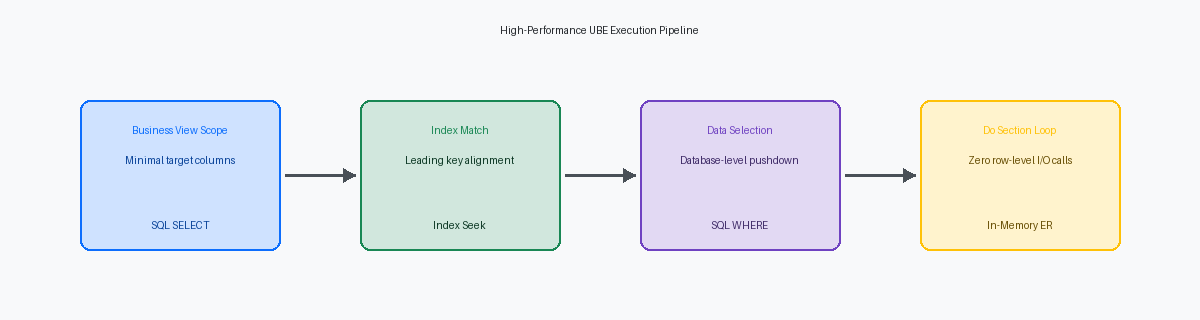
Move Row-Level I/O Operations Out of Do Section
Placing a table IO operation inside the Do Section of a UBE is the single most common mistake causing enterprise batch reports to run for hours instead of minutes. Consider a typical inventory transaction report scanning 500,000 records in the F4111 table. If a developer inserts an explicit Fetch Single against the F4101 Item Master inside the Do Section to grab the search text or stocking type, the batch process executes 500,000 individual SQL queries over the network. Each round trip introduces database latency, converting a sub-five-minute query into a multi-hour batch job that locks enterprise server resources and drags down database thread execution queues.
Combining required table reads into the section's underlying Business View removes those hundreds of thousands of discrete database calls instantly. Joining the F4101 to the primary F4111 driver table at the view level shifts the burden to the database engine, which retrieves the joined dataset via a single database cursor using pre-compiled execution plans. If conditional logic prevents a static view join—such as optional cross-reference lookups—load the target data into a C-based API memory cache during the Initialize Section, or query local environment variables once per level break rather than once per row.
Avoid using Event Rules to construct manual iteration loops with Select and Fetch Next commands over auxiliary tables like the F4074 or F0911 during row execution. Developers frequently write these manual ER loops to aggregate pricing adjustments or ledger amounts, unaware that they are compounding query latency on every single detail record. Configure Level Break Headers and Level Break Footers to handle sub-totals and running aggregations natively within the UBE engine. Letting the runtime handle event-driven section breaks eliminates custom ER accumulators and strips away millions of unnecessary table handles during large batch runs.
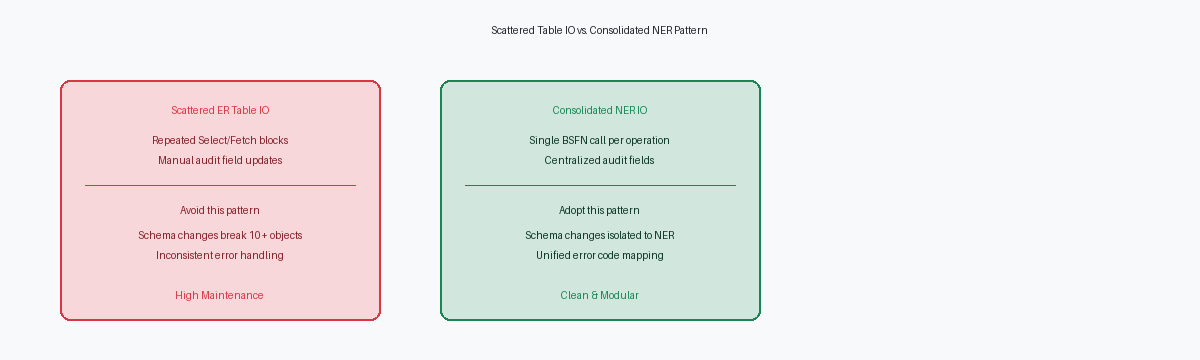
Manage Cache Handles and C Business Function Memory
An enterprise report processing 100,000 records will fail silently or drag the enterprise server into kernel paging if custom C Business Functions executed in the Do Section orphan their cache pointers. Call jdeCacheInit or jdeCacheAddItem inside an Event Rules loop without executing a corresponding jdeCacheTerminate or jdeCacheFreeCursor upon section completion, and the process memory footprint scales linearly with row count. A RUNBATCHThe executable process on the Enterprise Server that runs JD Edwards batch jobs. process growing from an initial 40 MB to over 3 GB during execution is almost always caused by unreleased heap allocations inside legacy C code.
The same memory decay occurs when developers use Open Table System Functions or raw database handles within Event Rules and fail to pair them with an explicit Close Table call in the End Section or Destroy Global Bank event. Leaving an unclosed table handle per iteration leaks database cursors on the database server while pinning handle objects in JDE middleware memory. On a 250,000-row batch run, this handle exhaustion routinely causes the database connection pool to choke, crashing parallel jobs on the enterprise server.
When managed correctly, in-memory jdeCache structures deliver dramatic performance gains rather than memory leaks. Caching static validation data—such as branch/plant constants from F41001 or cross-reference records—in a global C cache handle during the Initialize Section eliminates redundant I/O calls entirely. Swapping 100,000 individual SQL SELECT operations for memory-pointer lookups reduces database call latency by 80% to 90% on high-volume batch runs, dropping execution times from hours down to minutes.
Execute Pre-Flight SQL Profiling in Debug Logs
Never promote a custom UBE out of Development (DV) without capturing a trace level jdedebug.log during a representative test run. Opening the log and inspecting the literal SQL SELECT statement constructed by the JDE Middleware—specifically the WHERE clause—exposes hidden full table scans on multi-million row tables like F0911 or F4111 before that code ever touches Prototype (PY) or Production (PD). Developers frequently assume the UBE engine uses the index selected in Report Design Aid (RDA), but complex event-rule data selection or dynamic SQL overrides can silently strip index constraints, forcing the database engine into expensive table scans.
Quantify performance in DV by calculating execution time metrics per 10,000 records processed. Subtracting the timestamp of the first FET (fetch) API call from the final fetch call in the log yields the true database time versus Event Rules processing overhead. If processing 10,000 rows takes longer than 1.5 to 2.0 seconds at the database layer during local specs execution, the index selection or join condition is broken. Fixing this at the workstation level costs minutes; troubleshooting a running batch job that locks F0101 or F4211 in Production costs thousands in operational impact.
When designing extract reports that write directly to custom work tables, CSVs, or export interfaces, disable the RDA rendering engine entirely. Toggling the "Suppress Section Writing" system function call on detail sections and flagging utility sections as "Hide Section" cuts processing overhead by 30% to 50%. The Enterprise Server spends substantial CPU cycles formatting PDF page buffers, evaluating font metrics, and calculating line counts even if the batch output is never printed. Turning off visual rendering elements converts a layout-heavy report into a streamlined, high-throughput batch process.
Enforcing these checklist standards before promoting custom batch specs out of DV ensures that report runtimes stay in the minutes rather than locking enterprise queues for hours.
