




When a Universal Batch Engine (UBE)The JD Edwards background engine used to run reports, batch processes, and PDF generation. process drops into "Status E" inside Work With Submitted Jobs (P986110B)The standard JD Edwards application used to monitor, manage, and view the status of batch jobs., developers frequently jump straight to recompiling Event RulesJD Edwards' proprietary scripting language used to write custom business logic in applications and reports.. In reality, most fatal report crashes are not spontaneous server failures, but deterministic misalignments between custom C Business Functions (BSFNs)Compiled C programs used in JD Edwards to execute complex business logic and high-performance database operations., corrupted JDECACHEAn in-memory caching system in JD Edwards used to temporarily store and manipulate data during processing. pointers, and unhandled null parameters passed during dynamic data selection.
Diagnosing these failures requires a structured trace rather than trial-and-error patching. Understanding JDE UBE debug logs to troubleshoot failed report jobs systematically gives ERP leads and developers a repeatable method to isolate memory allocation errors, parse raw SQLStructured Query Language, the standard language used to communicate with and query relational databases. WHERE clauses, and capture exact BSFN call stacks right before a kernelA core background process on the JD Edwards server that manages specific tasks like batch jobs or security. process terminates on the enterprise serverThe central server in a JD Edwards environment that runs business logic, batch jobs, and database communication..
Locating Submitted Job Status and Process IDs
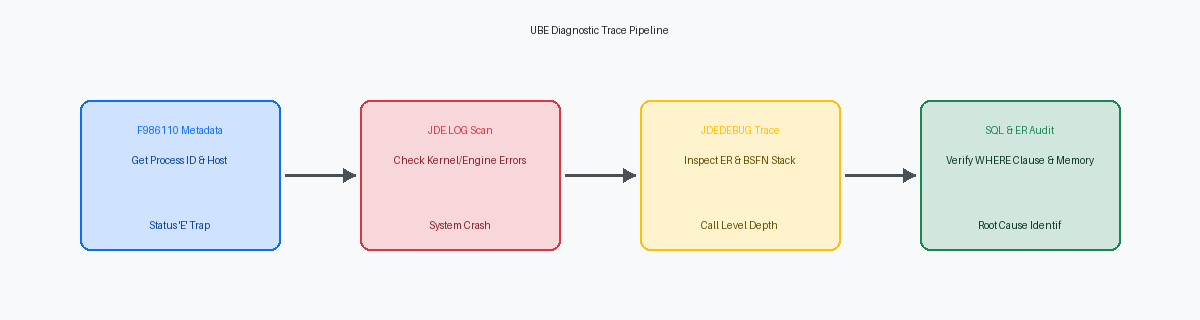
When a batch process fails, your immediate diagnostic baseline lives inside Work With Submitted Jobs (P986110B), backed directly by the F986110The JD Edwards Job Control Status Master database table that tracks all submitted batch jobs. Job Master table in the System schemaThe database area containing JD Edwards system-level tables, such as job control and security configurations.. Monitoring the JCJOBSTATUS field reveals exact execution state transitions—specifically when a job abruptly shifts from Processing (P) to Error (E). In most immediate P-to-E failures, the root cause is an unhandled C-code memory exception or lost database connection rather than a data validation issue in Event Rules.
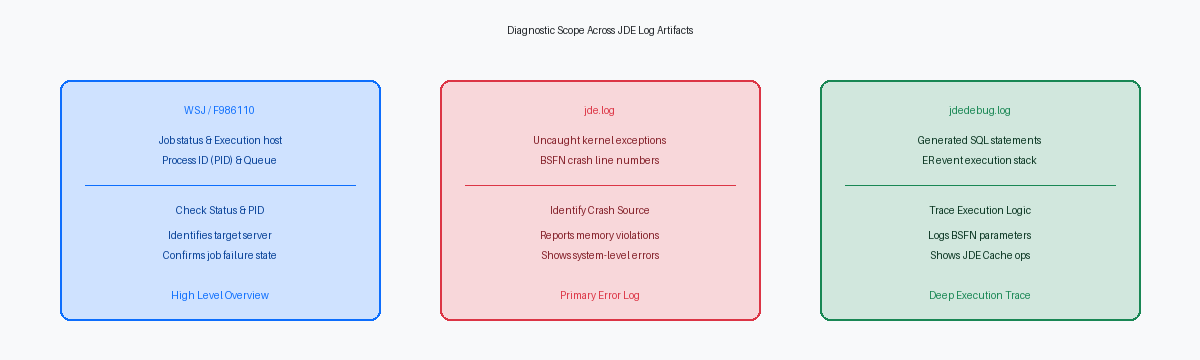
Opening the Row Exit for Job Details in WSJ exposes the Server Process ID, recorded in column JCEXEPROCESS. This integer is not merely an internal JDE reference; it maps 1:1 to the active operating system process ID running the UBE kernel on your Enterprise Server. Isolating this PIDProcess Identifier, a unique number assigned by the operating system to a running program. allows you to immediately target the corresponding jde_PID.log in your server's log directory—such as /u01/jdedwards/e920/log—without running costly system-wide traces or guessing which kernel managed the thread.
Engine crashes natively write critical diagnostic output directly into these standard jde_PID.log files before an administrator ever needs to enable deep call-level tracing. Memory allocation failures, array index bounds breaches, and SQL connection drops appear at the tail end of the standard log automatically. Toggling full debug tracing prematurely introduces 20% to 30% overhead on the Enterprise Server and dumps millions of routine APIApplication Programming Interface, a set of rules allowing different software components to communicate. lines, hiding the single pointer fault that killed the job.
Analyzing the Primary JDE.LOG for Fatal Engine Errors
When a UBE job drops directly from Processing to Error in F986110 without writing a PDF, starting with a massive trace log is a tactical mistake. The primary jde.log serves as the system-level exception reporter for kernel panics, memory violations, and unhandled C BSFN aborts. While trace files log execution sequence, this primary file captures the precise instant the enterprise server process dies.
Search the log directly for C/C++ runtime error signatures, such as EXCEPTION_ACCESS_VIOLATION or signal 11. These lines print the exact source file and line number where execution halted—for instance, B554201.c:412. When a custom C business function dereferences a null pointer or overflows a data structure, the runtime stack trace pinpoints the offending line of code, turning an enterprise-wide issue into a targeted C source fix.
Distinguishing platform runtime crashes from soft application errors saves teams significant analysis time. Soft business errors, like invalid item numbers or locked records in F4102, leave the runbatch process intact and output messages directly to the report error page. A fatal C engine crash immediately kills the underlying thread, leaving the PDF blank and generating zero application-level error messages.
When facing a report failure with no standard error message IDs attached, skip checking Event Rules entirely. Read the jde.log from the bottom up to isolate the failing thread ID, identify uninitialized MATH_NUMERIC variables or unallocated memory structures, and fix the C code directly. Recompile the target BSFN using busbuild.exe and deploy the update via a selective package build rather than refactoring working application logic.
Enabling and Filtering High-Volume JDEDEBUG.LOG Traces
Setting global debug logging (Output=FILE) in the enterprise server's jde.ini can fill a system drive in under half an hour, as a single batch process can generate hundreds of megabytes of trace text in seconds. Enterprise servers running dozens of concurrent batch threads will exhaust disk capacity or degrade kernel performance if global tracing stays enabled across a large batch run. Toggle tracing strictly at the job level in Work With Submitted Jobs (P986116) using Row > Advanced > Logging, or configure targeted user-level tracing in the [DEBUG] section of jde.ini using specific user handles. This confines log generation to the targeted process while keeping production performance overhead under 5%.
When analyzing a shared jdedebug.log where multiple processes write to the same file, sequential log entries become unreadable without isolating thread identifiers. Locate the UBE process ID (PID) or thread handle in the header of the job execution, typically logged in the format WRK:ProcessName_PID_ThreadID. Filtering the log file using command-line utilities like grep or sed for that specific thread ID strips out background noise from concurrent interactive sessions, subsystem jobs, and unrelated batch queues. This delivers a clean execution path showing the exact sequence of C API calls and Event Rules for your specific job instance.
Memory leaks during long-running processing loops remain a primary cause of silent UBE failures that yield no functional ER errors. Search the thread-filtered log for jdeAlloc and jdeFree statements to audit C memory management across record processing loops. If a custom business function allocates dynamic memory via jdeAlloc during the Do Section of a 50,000-row UBE loop without executing a corresponding jdeFree prior to returning ER_SUCCESS, the enterprise server kernel eventually exhausts heap memory and terminates. Verifying a higher count of allocation calls relative to deallocation calls pinpoints the specific custom C BSFN causing heap corruption.
Validating Data Selection and SQL Execution
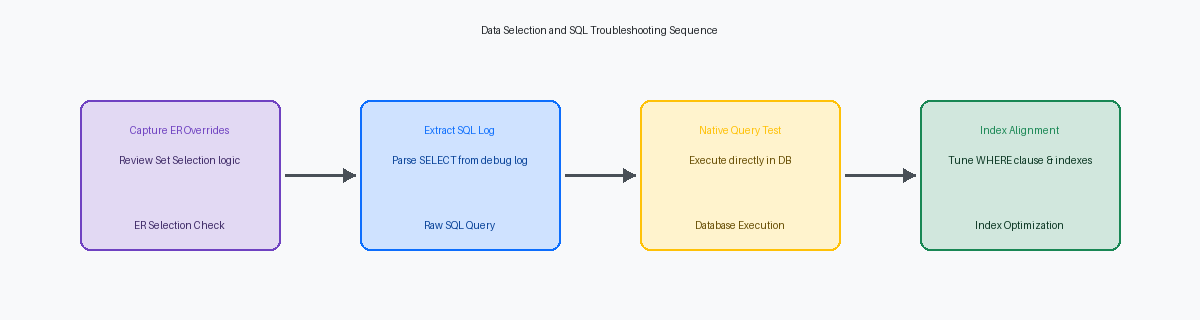
When a batch job hangs or hits a database timeout, the culprit is rarely the processing engine; it is the physical SQL statement sent to the database. Parsing the jdedebug.log for lines containing driver API calls like OCI0000054 or direct SQL text exposes the exact query, including implicit joins across business views and bad index selections made by the database optimizer. A custom join between F4211 and F4101 can execute a full table scan across millions of rows if an unindexed field forces the optimizer to drop the primary index.
Discrepancies between designed selection and executed SQL usually trace back to corrupted version specs stored in the F986110 job detail table. The report version's data selection is stored as a binary large object (BLOBBinary Large Object, a database data type used to store large, unstructured binary data like files or configurations.) inside the F986110 record; when an engineer checks in a version built against an outdated central objects package, this binary payload can misinterpret data dictionaryThe central repository in JD Edwards defining the properties, formatting, and validation rules for all fields. items. Comparing the raw WHERE clause rendered in the trace log against the visual layout in EnterpriseOne Development Client immediately reveals dropped criteria, such as a missing MCU or DCTO clause.
Event Rules logic can also quietly sabotage SQL performance. Calling the Set Selection Append Flag system function with a parameter of 0 or NO silently erases all base data selection defined on the report version before applying ER selection. Instead of appending dynamic criteria to user-entered filters, the engine constructs an unconstrained SQL statement against massive tables like F0911The JD Edwards Account Ledger table, which stores detailed general ledger transactions. or F0011 with zero date or ledger bounds. This results in an immediate full table scan, blowing out database temp space and locking server job queues.
Tracing Event Rules Execution and Cache Failures
When a report hangs at near 100% CPU or terminates after processing a handful of records instead of the full dataset, trace the Event Rules execution flow directly in JDEDEBUG.LOG. Following the execution path from the Do Section event through On Fetch Structure pinpoints exactly where an unbounded While loop is spinning or where a Stop Processing system call prematurely terminates execution. In driver-level custom sections, developers frequently embed custom logic within fetch events without accounting for null key pointers, causing the engine to evaluate the same record repeatedly until server memory is exhausted.
Log lines revealing JDE Cache errors during UBE execution point to unmanaged memory allocations rather than engine corruption. Seeing error return code COB0100011 or invalid handle exceptions during a jdeCacheFetch call means an earlier jdeCacheTerminate was bypassed in a conditional branch. On batch jobs running tens of thousands of detail iterations, skipping cache termination leaks hundreds of megabytes of heap memory on the Enterprise Server, eventually causing memory allocation failures in linked C BSFNs.
Another common failure mode is the silent completion of a batch job with zero detail lines printed. Misusing the Suppress Section Write system function within any conditional ER logic causes the UBE engine to execute all underlying database operations while bypassing the layout output engine entirely. The job finishes with a Status 60 in F986110 and generates a small PDF containing only section headers. Trace the log for section execution flags right after detail fetch BSFNs to confirm whether section writes were suppressed intentionally or skipped due to unhandled logic branches.
Resolving Intermittent BSFN Memory and Call Stack Issues
When a UBE crashes intermittently on Enterprise Servers running 64-bit Tools ReleasesJD Edwards system software updated to run on 64-bit operating systems for better memory management and performance., the root cause is frequently a structure mismatch between the compiled C BSFN header typedef and the data structure specs stored in the F9860 object dictionary. On 64-bit architectures, memory alignment rules require strict 8-byte boundaries for pointers and structure members. If a custom data structure is modified in Event Rules without re-parsing and re-compiling the corresponding C header file, memory offsets shift. The batch process might handle thousands of records cleanly before hitting an access violation when stack frames overlap during heavy data processing.
These failures routinely pass on local Fat Client executions while failing catastrophically in production. Local development workstations allocate memory sequentially with loose stack boundaries, effectively masking uninitialized C variables. Multi-threaded Enterprise Server call stacks, however, rapidly recycle memory addresses across concurrent batch engine processes. An uninitialized pointer or MATH_NUMERIC variable inside a custom C function will pull residual garbage from a prior thread's execution. Logic that passes isolated unit tests on a Fat Client will crash during a nightly processing run.
Resolving this requires regenerating the data structure headers via Object Management WorkbenchThe JD Edwards development application used to create, modify, and manage software objects., followed by a full business function rebuild across all server packages. Within the C source, explicitly clear structure memory using memset(&dsOutput, 0, sizeof(dsOutput)) at the entry point of every custom API call. Ensure Event Rules evaluate BSFN return codes—checking for ER_SUCCESS (0) versus ER_ERROR (2)—before triggering downstream processing. Leaving return codes unchecked allows uninitialized pointer states to cascade through the call stackA list of active functions or subroutines currently running in a program, showing the execution path., ultimately dropping the batch kernel without leaving an explicit entry in JDE.LOG.
