



A developer refactors an inefficient Do SectionAn event in JD Edwards report writer that executes repeatedly for each record fetched from the database. loop in a custom batch application, runs it once in DV against fifty records, sees it finish in three seconds, and declares victory. That is not an optimization; it is a guess. When that same modification hits production against 250,000 records, unindexed table I/OInput/Output operations involving reading data from or writing data to disk storage. and repeated business functionA reusable C or Event Rules program module in JD Edwards that executes complex business logic. calls frequently turn a 20-minute batch window into a two-hour bottleneck.
Rigorous JDE UBEJD Edwards Universal Batch Engine, the reporting and batch processing engine in EnterpriseOne. performance measurement before and after code change requires moving past wall-clock runtime on an unmonitored server. To prove a genuine improvement, you must quantify throughput in processed rows per second, isolate database wait states from business function execution times using deterministic log markers, and evaluate both runs against identical dataset volumes. Promoting modified batch logic without empirical, repeatable baseline metrics is how performance regressions quietly slip into nightly production schedules.
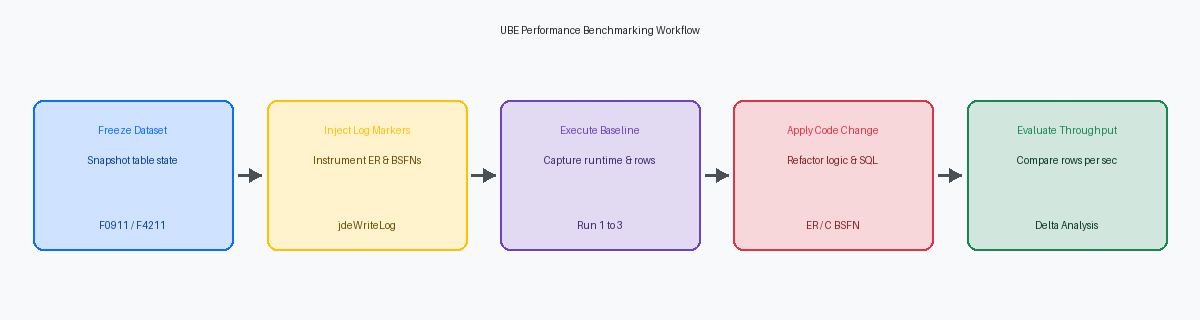
Establishing a Controlled Baseline and Test Dataset
Comparing batch execution times against live or continuously shifting transactional tables like F0911 or F4211 will mislead your team every time. When day-to-day transaction processing adds thousands of records between test iterations, variable table scan sizes and fluctuating index depths make it impossible to isolate code impact from data volume drift. A 12% runtime reduction means nothing if your underlying query scanned 40,000 fewer sales lines than it did yesterday.
Reliable benchmarking demands an exact, frozen test dataset restored into a dedicated non-production schema prior to every single execution pass. For sales order or billing modifications, stage a clean 500,000-record test slice of F4211/F42119 that mirrors production indexing, custom indices, and realistic data distributions across order types and statuses. Restoring this identical database snapshot before each test cycle guarantees that your baseline and modified versions evaluate the exact same volume and access paths.
Never record the first execution as your baseline number. Cold database buffer poolsMemory areas allocated by a database system to cache frequently accessed data pages for fast retrieval., disk read latency, and uncached JDE runtime specs produce an artificially inflated runtime that distorts comparison metrics. Execute four consecutive iterations, discard the initial cold-cache run, and calculate the standard deviation across the remaining passes to establish a statistically sound reference point.
Lock down the Enterprise Server environment by restricting the job to a dedicated, single-threaded batch queue. Running benchmarks on multi-threaded queues introduces CPU contention, thread switching overhead, and lock escalation from concurrent jobs. To measure raw code efficiency accurately, your report must run in absolute isolation against fixed hardware resources.
Injecting Log Markers for Granular Event Timing
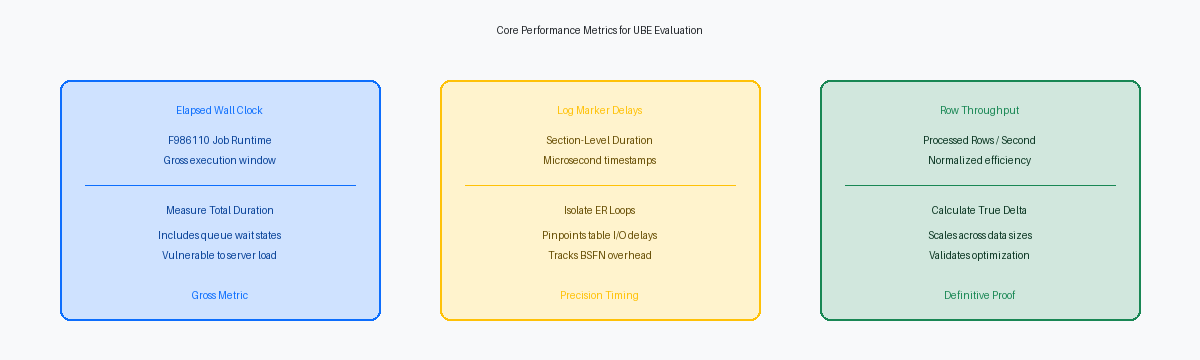
The Job Control Status table (F986110) records only macro start and completion timestamps in JCSTRTTIME and JCENDTIME, providing a single aggregate elapsed duration. If a custom sales extract UBE runs for 48 minutes across 250,000 records, F986110 confirms the job is slow, but it cannot differentiate whether 40 minutes were spent inside a single fetch loop or distributed across business function executions. Relying solely on job table metadata leaves developers guessing where the processing bottleneck actually sits.
A dedicated C BSFNA C language Business Function compiled into native code for performance-critical JD Edwards logic.—such as a custom B55PERF exposing the native jdeWriteLog API—resolves this visibility gap by injecting microsecond-level checkpoint timestamps directly into the active jde.log. Calling a lightweight C-level logging wrapper bypasses the crippling I/O overhead of enabling full SQL or Event Rules debug tracing (jdedebug.log), which routinely distorts batch execution times by 300% to 500%. The execution cost of pushing a targeted string into the base enterprise server engine log is negligible, consistently measuring under 0.05 milliseconds per invocation even when executed thousands of times within a batch run.
Place these marker calls immediately before and after intensive table I/O operations, such as bulk F4211 or F0911 cursor loops. This isolates pure database query latency from downstream Event Rules logic and internal cache lookups. Standardizing marker syntax with searchable tags like PERF_MARK_START:Section_Name:LoopID and PERF_MARK_END:Section_Name:LoopID makes log post-processing trivial. A short Python or PowerShell script can ingest the resulting log, parse the tagged deltas, and output exact millisecond-level execution profiles for every critical section before and after your code refactoring.
Correlating Runtime with Precise Row Counts
Relying strictly on execution duration from the Job Control Status Master (F986110) creates a false sense of optimization. If an R42565 invoice print run drops from 45 minutes down to 30 minutes, it appears to be a 33% efficiency gain until you discover that updated business data selection filtered out 40% of the sales order lines. Without pairing runtime against exact row volumes, raw duration numbers provide zero valid insight into engine efficiency.
Developers must capture data volumes explicitly by maintaining internal counter variables across the report event cycle. Initialize counters in the Initialize Section event, then increment discrete variables inside the Do Section for records fetched, records meeting business criteria, and records written or updated in destination tables. Output these totals to the execution log or report footer during End Section processing to isolate engine performance from shifting data sets.
Always normalize performance into rows processed per second rather than comparing aggregate runtimes across test iterations. A modified UBE processing 320 rows per second across an 80,000-record batch is fundamentally more efficient than a baseline version processing 190 rows per second across 20,000 records, even though the baseline job finished with fewer total elapsed minutes.
Comparing section-level throughput against the F986110 JCETIM elapsed execution time instantly exposes hidden infrastructure drag. When event logs prove a report spent 45 seconds executing its primary Do Section loop but F986110 records a 240-second total runtime, that 195-second gap points directly to initialization overhead, unindexed table opens, or database lock contention on critical transaction tables like F0911 or F41021.
Profiling SQL Execution and BSFN Calls via Jdedebug
Isolating performance bottlenecks down to the millisecond requires capturing a clean trace, but running a batch job across an entire production-scale dataset with debug logging active will choke the enterprise server on synchronous disk writes. Restrict debug-enabled runs strictly to an isolated sample of 1,000 to 5,000 records. This record volume generates an accurate, repeatable representation of iterative processing patterns without allowing massive I/O bottlenecks to mask or distort the true runtime differences between your code revisions.
Evaluating the resulting jdedebug.log trace immediately separates database latency from business function execution overhead. Analyzing the precise timestamps between SQL parse, execute, and fetch statements across before-and-after runs confirms whether a code modification successfully eliminated redundant SELECT queries against tables like F4101 or F0911. If a modified query or custom index omission inadvertently introduced an unindexed table scan, the trace exposes it instantly as an extended elapsed duration between the OCIStmtExecute or SQLExecute call and the subsequent fetch statements, revealing exactly how much database wait time was added.
On the logic engine side, tracing nested BSFN invocations uncovers call-stack overhead hidden inside tight event loops. A single utility function executing in 0.3 milliseconds appears harmless, yet it accumulates 30 seconds of pure processing delay when fired 100,000 times inside the Do Section. Comparing before-and-after callObject execution trees verifies whether your refactoring successfully pushed static calculations out of repetitive event rules, bypassed unnecessary master business function overhead, or replaced repetitive table I/O with memory-resident cache structures.
Calculating Throughput Metrics for Before-and-After Analysis
Raw elapsed time is a deceptive metric when input datasets fluctuate between test runs. The only defensible benchmark is throughput velocity, calculated directly as Processed Rows divided by Total Wall Clock Seconds. If a customized R42800 processes 120,000 sales order lines in 1,450 seconds, your baseline is 82.7 records per second; your refactored code must demonstrate a measurable leap past 250 records per second on an identical footprint to justify deployment.
To build an airtight business case, construct a comparative matrix combining total elapsed time, Enterprise Server CPU utilization, and records per second. A successful refactoring must prove a quantifiable reduction in both the SQL query count per processed transaction and the total database wait state duration. Cutting thirty minutes off batch execution means nothing if your revised fetch loops simply masked the problem by saturating the database engine with redundant table scans.
Calculate the percentage delta across every discrete execution phase rather than relying solely on the final job execution time. Tracking metrics across multiple execution cycles ensures you have not optimized an inner event rule loop at the expense of heavy downstream table updates in the End Section. Moving logic out of the Do Section can easily backfire if batched table inserts create lock escalations on central transaction tables like the F0911 or F4211.
Formalizing this before-and-after throughput calculation into a standardized scorecard gives architecture review boards the empirical proof required for technical sign-offs. Documenting clear baseline figures, post-refactoring throughput, and percentage deltas eliminates speculative performance claims and guarantees the batch window actually contracts when code reaches production.
Verifying Scalability and Eliminating Regression Risks
A custom UBE that runs clean across 5,000 rows in DV920 can completely stall in production when exposed to true enterprise volumes. Unbounded JDE cache structures, memory leaks in custom C business functions, and runaway temp space allocation rarely surface during small unit tests; they compound exponentially as data sets grow. Validating performance requires executing the refactored code across discrete volume bands—50,000, 250,000, and a 1,000,000-row stress run in PY920—to verify that processing time scales linearly.
Throughout the 1,000,000-row execution, database health requires as much scrutiny as overall runtime. Monitor tempdbA system database used by SQL server database engines to hold temporary tables and intermediate query results. expansion, index fragmentation, and lock escalationA database mechanism converting multiple fine-grained locks into a single table-level lock to conserve memory. patterns on primary transaction tables such as F0911 or F4211. An uncommitted table update or a missing index inside a high-frequency Do Section event easily triggers row-level locks that cascade into blocking chains, directly penalizing concurrent interactive users working in P42101 or P0911. If database wait events spike during the high-volume band, the refactored code has simply offloaded the processing bottleneck onto the database tier.
Runtime gains are worthless if core data integrity is compromised. Once scalability is confirmed, extract the baseline and post-change target records into staging tables to run a byte-for-byte diff on the resulting data sets. Validate that every ledger code, tax calculation, and transaction amount matches the original output exactly, confirming that your algorithmic changes did not bypass master business function validation rules or silently drop required audit records.
If you are baseline-profiling batch processes for a Tools 9.2 upgrade or remediating nightly UBE jobs that breach their maintenance window, anchoring your refactoring workflow to repeatable baselines and throughput metrics guarantees that code optimizations deliver real, defensible runtime gains in production.
