




A custom batch report processing over 100,000 F0911The General Ledger table in JD Edwards that stores all account transaction details. records should not run for four to six hours. When it does, the culprit is rarely database indexing or hardware constraints; it is poor Event Rules (ER)The proprietary scripting language used in JD Edwards to define business logic within applications and reports. construction. Executing systematic JD Edwards UBEUniversal Batch Engine, the JD Edwards tool used to create and run background reports and batch processes. performance tuning to reduce table reads requires moving away from row-by-row processing, where developers place Fetch SingleA database command in JD Edwards that retrieves one specific record from a table based on a unique key. or Select/Fetch Next statements inside the Do Section or Do Loop events of a UBE, forcing the enterprise server to execute hundreds of thousands of redundant SQL SELECTA standard database command used to retrieve data from one or more tables. statements against the database. By analyzing JDEDEBUG logsDetailed trace files that record every action, SQL statement, and business function call during a JDE process., we can isolate these loops, tighten driver section data selection, and refactor the ER logic to use JDE memory cache or custom C business functionsPrograms written in C that perform complex logic or high-performance tasks within JD Edwards. instead of making constant database roundtrips.
The Cost of Row-by-Row Table IO in Event Rules
A single line of Event Rules code can quietly paralyze a batch process. Every standard "Fetch Single" or "Select/Fetch Next" statement placed inside a Do Section event does not execute in a vacuum; it translates directly to an independent, round-trip SQL statementA command used to communicate with a database to retrieve, update, or delete information. submitted to the database engine. In a typical Oracle or SQL Server deployment, the overhead of network latencyThe delay or time it takes for data to travel across a network between a client and a server., statement parsing, and execution planThe sequence of steps a database engine uses to efficiently retrieve or process data for a query. evaluation applies to every single call, regardless of how small the payload is.
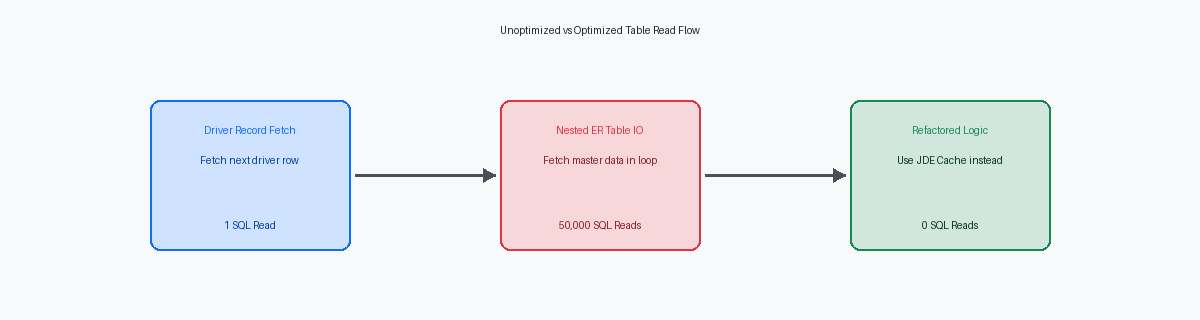
Consider a standard financial integrity report where the driver section processes 50,000 to 100,000 journal entry lines from the F0911 table. If a developer places a nested Fetch Single on the Address Book Master (F0101The Address Book Master table in JD Edwards containing primary information for entities like customers and employees.) inside that loop to retrieve an alpha name, the EnterpriseOne batch engine initiates tens of thousands of individual network round-trips to the database. Even if the database server resolves each query in a seemingly negligible one to two milliseconds, the cumulative network and database processing time alone adds significant cumulative latency to a single event loop.
Developers often overlook this cumulative latency because individual Event Rules statements look harmless in the Object Management Workbench (OMW)The central development environment in JD Edwards for managing code, objects, and project lifecycles.. In reality, these repetitive database calls frequently account for the vast majority of total UBE execution time, often exceeding 80%, leaving the enterprise server's CPU idling while it waits for the database to respond.
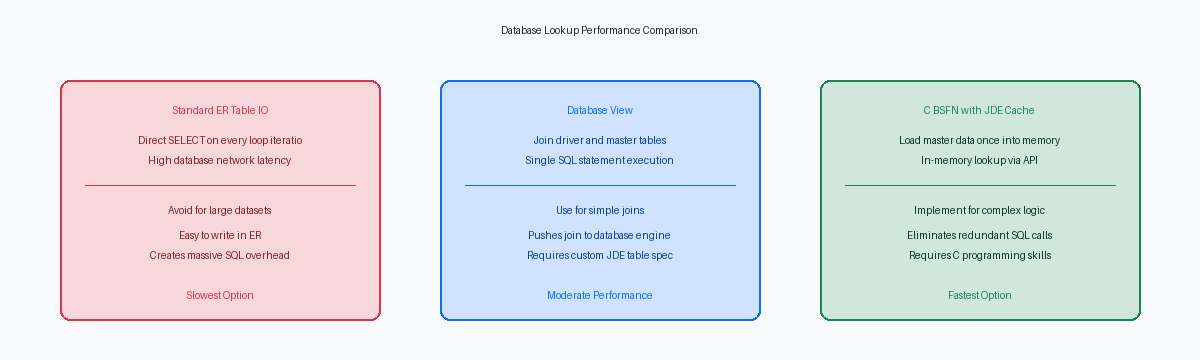
Replacing these row-by-row fetches with database views, table joins, or memory-based caching mechanisms can instantly drop a UBE's runtime from several hours to a few minutes. By shifting the heavy lifting of data aggregation to the database layer or utilizing JDE's internal cache APIs, you eliminate the chatty network behavior that chokes batch queues during month-end processing.
Diagnosing Table Reads with JDEDEBUG Logs and SQL
To stop guessing why a custom UBE is dragging, you must look at the raw SQL generated by the JDB database middlewareThe software layer in JD Edwards that translates application requests into database-specific SQL commands.. Set Output=FILE under the [DEBUG] section of the local or enterprise server jde.iniThe primary configuration file for JD Edwards software settings on servers and workstations. to force EnterpriseOne to capture every single database interaction. This generates a jdedebug.log file that maps the Event Rules table I/O directly to native SQL statements like SELECT, UPDATE, and INSERT.
Feeding a multi-gigabyte log file into a standard text editor is a rookie mistake that crashes your workstation. Instead, run the log through Performance Workbench, an Oracle-provided utility that parses the trace file and aggregates SQL statements by execution count and duration. This analysis immediately highlights the exact frequency of SELECT statements hitting high-volume tables like the F0911 or F4211The Sales Order Detail table in JD Edwards that stores individual line items for sales transactions., exposing hidden loops that execute thousands of times for a single PDF page.
A highly efficient UBE maintains a database read-to-record-processed ratio close to 1:1, meaning each fetch from the driver section maps to a single, targeted database lookup. In poorly optimized reports, this ratio frequently spikes to 50:1 or higher, indicating that the engine is hammering the database with dozens of redundant queries to process one single transaction.
When the log reveals high execution counts with poor response times, you must verify if the database is actually using your indexes. Run SQL Server Profiler or query Oracle's v$sql_plan to inspect the execution plans of the queries identified in your log. This step reveals whether the database optimizer is ignoring your custom index on F41021 or performing a costly full table scanA database operation where the engine reads every row in a table because no suitable index is available. because of a missing join condition in your table I/O.
Optimizing Driver Section Data Selection
I recently refactored a custom sales analysis UBE where the developer allowed the primary driver section to fetch every record from the F4211 table for the current fiscal year, only to discard the vast majority of them, in our experience around 80% to 90%, using an If statement inside the Do Section. This broad data selection forces the UBE engine to retrieve hundreds of thousands of unnecessary rows from the database into enterprise server memory. The database spends cycles executing select statements and transmitting packets over the network, only for the runtime engine to immediately drop the data on the floor.
You must push the filtering work back to the database tier where it belongs. Programmatically manipulating the SQL WHERE clause using the Set User SelectionA JDE system function used to dynamically filter the data retrieved by a report section. system function in the Initialize Section is exponentially faster than evaluating conditions within the Do Section. For example, if you need to filter F4211 records by Next Status (NXTR) and Line Type (LNTY), explicitly calling this system function restricts the initial cursor open to only the matching dataset, preventing the middleware from processing dead weight.
To make this programmatic selection effective, the target fields must align with an existing database index. Running a query against F4211 or F0911 on a non-indexed field like Transaction Date (TRDJ) triggers a full table scan, destroying database performance. Additionally, omitting the business unit (MCU) or company (CO) from the selection criteria on partitioned databases is a common disaster, often increasing table read times by three to four times because the database engine cannot prune partitions and is forced to scan every partition in the schema.
Refactoring Nested Loop Logic and Table IO
Placing a Select and Fetch Next loop inside the Do Section of a UBE is the fastest way to degrade batch performance from minutes to hours. If the driver section processes 50,000 to 100,000 records and the inner loop queries a secondary table like the F4211 without tight bounds, the enterprise server executes hundreds of thousands of redundant database roundtrips. This geometric growth in table reads chokes the database engine, especially when developers neglect to map the inner Select keys to match a composite index exactly, forcing full table scans instead of rapid index lookups.
These nested structures frequently leave behind a trail of unclosed database cursors. Every open table pointer that lacks a corresponding explicit Close statement in the Event Rules leaks memory and keeps cursor handles open on the enterprise server. Over a run of tens of thousands of iterations, this omission consumes system resources until the database limits are breached, resulting in a sudden, unexplained UBE failure. Explicitly closing every table handle at the end of the conditional block is non-negotiable for stable batch processing.
Repetitive queries for static configuration data, such as fetching UDCUser Defined Codes, a JDE feature for creating customized lists of values used throughout the system. values from the F0005, should never occur inside these loops. Rather than issuing thousands of distinct F0005 reads for the same document types, load this reference data once into a JDE cache using the jdeCache APIA set of programming tools in JDE used to store and retrieve data in the server's memory for faster access. within a custom C business function during the Initialize Section of the UBE. Fetching from memory rather than hitting the database reduces I/O execution time to near zero. For simpler requirements, loading key-value pairs into a memory array at startup achieves the same overhead reduction without the database penalty.
Utilizing JDE Cache and Business Functions
Event Rules table I/O introduces a performance tax because the toolset's interpreter processes each statement sequentially with significant runtime overhead. When a UBE executes a simple F0014.FetchSingle inside a loop of 100,000 or more records, the ER engine repeatedly negotiates database connections and parses SQL statements. Moving this lookup logic into a compiled C business function bypasses this interpreter overhead entirely, executing at native machine-code speed.
By developing a custom C business function like B550001 using JDECACHE APIs, you initialize a named, in-memory cache on the enterprise server during the UBE's Initialize Section event. The first database read loads the required record into memory; subsequent requests are resolved via memory pointers instead of database roundtrips. This approach eliminates SQL reads for static master data, storing keys and values in a structured memory block that exists only for the duration of the UBE run.
For high-volume UBEs processing 100,000 or more records, caching master data like payment terms (F0014) or tax rates (F4008) reduces database calls by 90% or more. Instead of hitting the database tens of thousands of times to resolve the same ten payment terms, the UBE queries the database a handful of times to populate the cache, then performs lightning-fast memory lookups for the remaining records.
A custom C business function handles complex memory structures and binary searches far faster than ER can loop through database tables. Using the jdeCacheFetchPosition API allows the system to perform high-speed binary searches on indexed cache keys, returning data in microseconds. This shifts the processing bottleneck from the database tier to the application server's RAM, where memory access times are measured in nanoseconds rather than the milliseconds required for physical disk I/O.
Measuring Performance Gains After Refactoring
You cannot rely on subjective user feedback to validate a refactoring effort; you need hard numbers from the Job Control Status Master table (F986110). Querying the fields JCSTRTTIME (Start Time) and JCENDTIME (End Time) where the job status (JCST) is 'D' (Done) allows you to calculate the exact execution duration in seconds. Compare this post-optimization baseline against a minimum of three historical runs of the unmodified UBE to account for transient network or database load variance.
Next, isolate the database impact by comparing the total SQL statement execution count before and after the code changes. Generating a jdedebug.log for a representative sample of several thousand records reveals the exact drop in physical table reads. In a recent project involving a heavily customized R42565 (Invoice Print), refactoring nested F41021 table I/O into a memory-resident fetch reduced database round-trips from over a million to fewer than 15,000 for a single batch run.
Speed must not come at the cost of stability, particularly when swapping disk I/O for JDE cache or large memory structures. Monitor the Enterprise Server's CPU usage and memory footprint via top on Linux or Task Manager on Windows during execution. A poorly managed JDE cache that fails to call deallocateUserCache or free pointers in custom C business functions will manifest as a memory leak, eventually crashing the jdenet_kThe kernel process on a JD Edwards enterprise server responsible for handling specific tasks like batch processing or security. kernel process.
When these metrics align—reduced database statements, stable memory allocation, and clean C code execution—a successful tuning exercise typically yields a 70% to 90% reduction in overall runtime for high-volume batch runs. Crucially, run a complete PDF and table comparison using a tool like PDF Diff to guarantee that the optimized logic produces identical financial and operational outputs to the legacy version.
If reducing table IO in your high-volume UBEs has highlighted broader bottlenecks in your custom code estate, the technical articles on C BSFN memory management and SQL view integration provide deeper architectural guidance for optimizing enterprise ERP performance.
