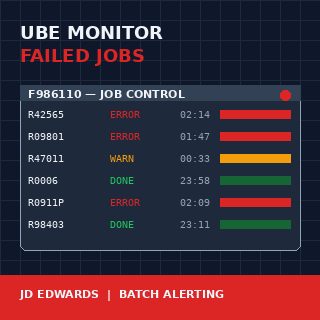
A JD Edwards EnterpriseOne batch job monitor for failed UBE reports is one of those builds that pays for itself in the first month and keeps paying every quarter close after that. The Server Manager console will tell you a job ended in error, but it will not wake anyone up about it, and it will not tell you that the R42565 confirmation run failed for the third night in a row at 02:14. By the time the warehouse supervisor calls at 7 AM asking why no pick slips printed, the data is already four hours stale and the morning is already lost.
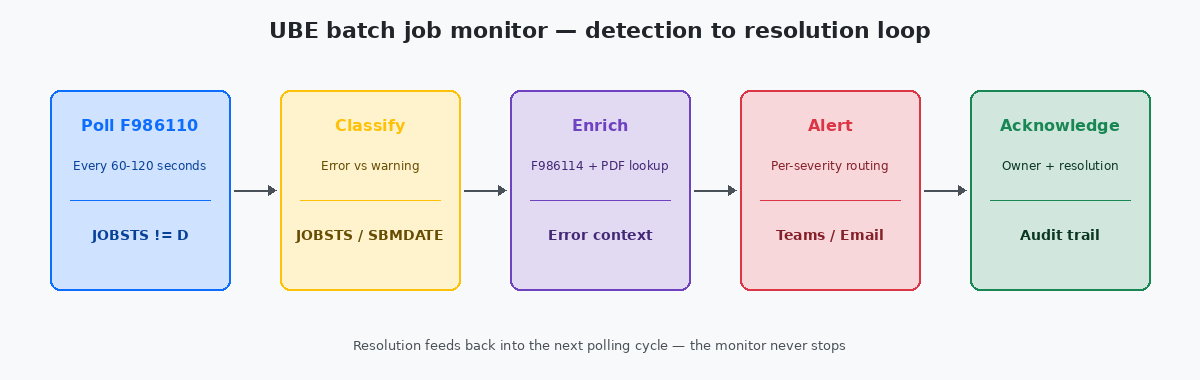
Every mature JDE installation I have worked with eventually builds one of these monitors. The ones that work share three properties: they poll F986110Job Control Master — the JDE table that records every UBE submission, its status code, start and end times, and the server it ran on. on a tight cadence, they classify errors by impact, and they route alerts to channels that match severity. The ones that fail are usually email-only, fire on everything, and get muted by the operations team within six weeks.
What "failed" actually means in F986110
The Job Control Master is the single source of truth for batch execution in JDE E1. Every UBE submission writes a row here, identified by JOBNBR, with a JOBSTS column that walks through a small set of single-character values: W (waiting), P (processing), D (done), E (error), CE (canceled with error), S (canceled by user), H (held). A naïve monitor watches for JOBSTS = E and alerts. A useful monitor knows the difference between E and CE, treats H jobs older than 30 minutes as a separate problem, and recognises that a P job that has been processing for six hours when it normally finishes in twelve minutes is also a failure, just a quieter one.
The SBMDATE and SBMTIME columns give you the submission timestamp; ENDDATE and ENDTIME give you completion. The gap between submission and the current system time is what lets you flag stuck jobs. The PID column tells you which UBE it was, which matters because R0006 (EDI inbound) failing has different downstream consequences than R09801 (Post General Ledger) failing, and the monitor needs to know which is which.
The SRVRNM column tells you which enterprise server ran the job. On a multi-server installation this is not cosmetic information — a recurring failure on one server while the others run clean is an infrastructure problem, not a UBE problem, and the monitor should surface that pattern.
The polling loop and why timing matters more than logic
The simplest working monitor is a SQL query against F986110 run every 60 to 120 seconds by a scheduled job. Run it more frequently and you put load on the database for no human benefit — nobody is going to react to an alert in under a minute anyway. Run it less frequently and you lose the ability to catch short-cycle failures before the next dependent job tries to start.
The query itself is straightforward: pull every row where JOBSTS is in ('E','CE') and ENDDATE is greater than or equal to the previous polling cycle's high-water mark. Track the high-water mark in a small custom table so a restart of the monitor does not replay every error from the last six months. The pattern is the same idempotency principle that applies to any data load — running the monitor twice should produce one set of alerts, not two.
The catch most builds miss is timezone handling. F986110 stores dates in JDE Julian format and times as integer HHMMSS values, both in the time zone of the enterprise server. If the monitor runs on a different host in a different time zone, the comparison logic has to convert explicitly. I have debugged a monitor that was silently missing every error from 23:00 to midnight because the comparison crossed a date boundary on the wrong side.
Classifying severity without writing a thousand rules
The instinct on the first build is to write a rule per UBE. By the time you have 40 rules you have an unmaintainable mess, and by the time you have 200 nobody knows which rules still apply. The pattern that scales is severity by category, not by job.
Three categories cover roughly 95% of real installations. Critical means revenue-impacting or compliance-impacting: EDI inbound and outbound (R47*), sales order shipment confirmation (R42565), invoicing (R42565, R03B11Z1I), period close (R09801, R0911P, R09866), payroll generation. Standard means business-impacting but not same-day: master file integrity reports, reorganisation jobs, replication monitors. Noisy means errors that recur predictably and are usually data issues: integrity reports flagging known orphan records, custom UBEs that frequently fail on bad input.
The classification lives in a small lookup table keyed by PID, with a default of Standard for anything unmapped. New UBEs get added to the lookup as part of the development promotion checklist, not afterwards. The monitor reads the lookup once per polling cycle and caches it for the rest of the cycle.
Routing alerts to channels that actually get read
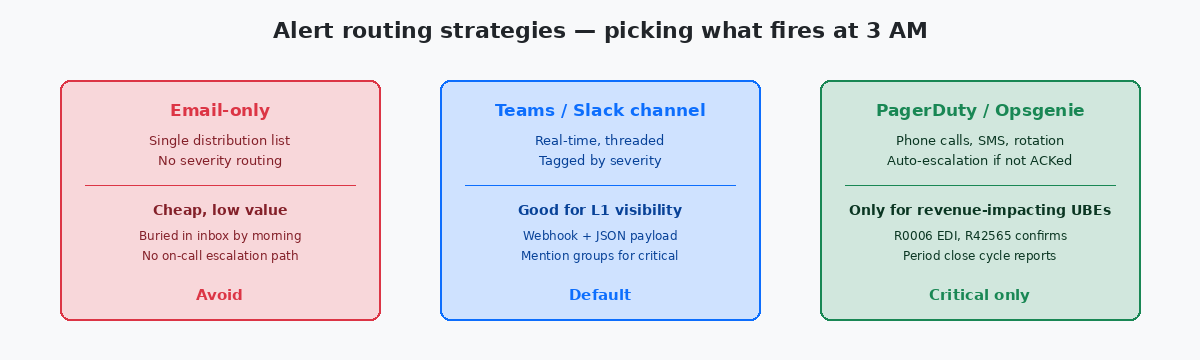
Email is where alerts go to die. The first version of every monitor I have inherited sends to a distribution list with twelve people on it; by month three, ten of them have an Outlook rule moving the messages to a folder nobody opens. The pattern that works is severity-mapped routing: critical alerts go to a paging system with on-call rotation, standard alerts go to a dedicated Teams or Slack channel with the operations team in it, noisy alerts go to a daily digest email that summarises rather than spams.
The Teams channel pattern is the workhorse for standard alerts. A webhook receives a JSON payload with JOBNBR, PID, server, error timestamp, and a direct link to the PDFThe UBE output file generated for every batch job, stored in the PrintQueue directory on the enterprise server. The error context usually lives in the last few pages. output and the job log on the Server Manager web console. The link matters — without it, every alert costs five minutes of navigation before the engineer can start diagnosing. With it, the diagnosis often happens directly from the alert.
The paging system, whether PagerDutyA widely used incident response platform that handles on-call schedules, phone alerts, SMS and automatic escalation when alerts are not acknowledged within a defined window. or Opsgenie or one of the open-source equivalents, should fire on roughly five to ten PIDs total, not on every red row in F986110. The fewer jobs that wake people up at 3 AM, the more credibility the monitor keeps. The list of paging-eligible UBEs should be reviewed every quarter, because some jobs become critical and some stop being so.
Alert deduplication is the detail every team gets wrong on the first build. When the period close fails, it does not fail in isolation — R09801 erroring usually means R0911P and R09866 will also error in the next ten minutes, because they depend on the same data state. Without deduplication the on-call engineer gets four alerts for one root cause and has to mentally collapse them. The pattern that works is a five-minute alert window keyed by category and server, where the monitor emits one rolled-up alert listing all related failures rather than firing four times. Twenty lines of grouping logic, measurable improvement in mean time to acknowledge.
Enriching alerts with context the on-call engineer actually needs
The difference between a useful alert and a tax on attention is the context attached. A bare "R42565 failed on server JDE_ENT01" forces the engineer to log in to the Server Manager, find the job, download the PDF, open it, scroll to the bottom, and read the error stack. Multiply that by every alert and the monitor becomes a productivity drain.
The enrichment that pays for itself comes from joining F986110 to F986114 (the job step detail) and pulling the last few lines of the job log directly into the alert payload. The error message — "Invalid Branch/Plant for Item 30000" or "Mandatory Processing Option PR1 not set" — tells the on-call engineer in five seconds whether this is a data issue (call the analyst) or a code issue (call the developer). Without that line, every alert is a coin toss.
The second piece of enrichment that scales is recurrence detection. If the same PID has failed three nights in a row at roughly the same time, the alert payload should say so. The fix is rarely the same as the fix for a one-off failure, and the responder needs to know which they are looking at before they start. A small recurrence table, keyed by PID and rolling over weekly, is fifty lines of SQL and saves hours per month.
The last piece, often skipped, is the acknowledgement loop. When the on-call engineer fixes a job, they should be able to mark the alert resolved with a short comment — "PO bad data, fixed in F4311 batch 1207" — and have that comment land in a small monitor history table. Three months later, when the same UBE fails on the same day of the month, the next responder sees the prior resolution and recognises the pattern in thirty seconds instead of starting from scratch. The audit trail also gives the operations manager something concrete to put in the quarterly stability report: not "the monitor caught 247 errors", but "247 errors, mean time to acknowledge 11 minutes, top three offenders R47011, R42565, R09801, all fixed within SLA". That is the data that justifies the build.
If batch monitoring is the kind of operational discipline you want more of, the related articles on JDE Server Manager configuration, on UBE checkpoint and restart design, and on F986110 archival strategies cover the operational stack from the other side. The technical project portfolio on this site documents two of the production monitors that produced the patterns described here.